Download
1 / 48
480 likes | 1.38k Views
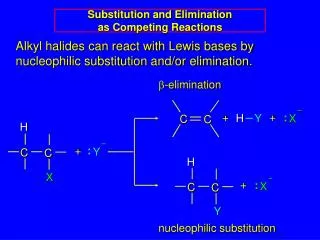
Teaching Substitution and Elimination With Real-Life Examples. Bob Hanson St. Olaf College, Northfield, MN http://www.stolaf.edu/people/hansonr 20 th Biennial Conference on Chemical Education Indiana University July 29, 2008. Road Map for This Presentation.

E N D
Teaching Substitution and Elimination With Real-Life Examples Bob Hanson St. Olaf College, Northfield, MN http://www.stolaf.edu/people/hansonr 20th Biennial Conference on Chemical Education Indiana University July 29, 2008
Road Map for This Presentation • Background: Data-Driven Chemistry • The Course: 1st Semester Organic • The Data: 39 reactions • The Exam: 25 questions • Conclusions
Background: “Data-Driven” Chemistry generate data analyze data extrapolate hypotheses generate hypotheses
Background: “Data-Driven Chemistry” • Start with raw data • Transform the data into meaningful information • Create a working model R. M. Hanson, S. A. Bergman, "Data-Driven Chemistry: Making Molecular Models (Literally) from Electron Diffraction Data”, J. Chem. Educ.1994, 150
Background: focus on analysis analyze data (identify trends) generate data (experimental) generate hypothesis (explain shapes and trends) extrapolate hypothesis (predict shapes)
Application: organic chemistry analyze data (identify trends) generate data (experimental) generate hypothesis (explain reactions) extrapolate hypothesis (predict reactions)
The Course 1st semester of a standard two-semester course 55 students in my section (approx. 120 students total): 39 sophomores 13 juniors 3 seniors Textbook: Paula Bruice, Organic Chemistry, 5th ed.
Focus: substitution and elimination analyze data (identify trends) generate data (experimental) generate hypothesis (explain reactions) extrapolate hypothesis (predict reactions)
Data Sources Ingold, Structure and Mechanism in Organic Chemistry, 2nd Ed., 1969 Compendium of Organic Synthetic Methods, 1971 M: March, Advanced Organic Chemistry, 3rd Ed., 1985 V: Vogel, Textbook of Practical Organic Chemistry, 5th Ed., 1989
The Exam • 55 minutes • 25 multiple-choice questions • Instructions: • In each case, read each possible answer, use a process of elimination, and circle the BEST answer. If you are having trouble deciding between two answers, briefly explain your final choice. If you do so, use just a few words, just to clue me in to what you are thinking. Do not dwell on any particular problem for an extended period of time. Each question is worth 2 points.
The Exam average score: 75% (average exam score for the semester: 73%) three additional questions
The Exam This test was: (a) Easier than I thought it would be. (b) Somewhat harder than I thought it would be. (c) WAY harder than I thought it would be.
The Exam This test was: (a) Easier than I thought it would be. 15 (b) Somewhat harder than I thought it would be. 14 (c) WAY harder than I thought it would be. 1 (d) Maybe a bit harder. 1 (e) About as hard as expected. 16 (f) Not too bad. 1
The Exam I think looking at the data this way… “…is GREAT, I learned a lot!” “…seems to apply to the real world more so than the book.” “…makes for an interesting way of learning about these reactions.” “…really works with the way I think. I liked it a lot!”
The Exam I think looking at the data this way… “…is GREAT, I learned a lot!” “…seems to apply to the real world more so than the book.” “…makes for an interesting way of learning about these reactions.” “…really works with the way I think. I liked it a lot!” “…you can see and think through all parts of the reaction, doesn’t feel as much like memorization and regurgitation of info…you can think through why an answer is right or wrong in comparison with others.”
Conclusions 1/3 • For the most part, students “got it.” • Generally, students did not have trouble with the • definitions of SN1, SN2, E1, and E2. • A significant number of the students were still having • trouble identifying strong and weak bases.
Conclusions 2/3 • Stereochemical concepts and notation were integrated • into 6 of the 25 questions (24%). For these questions, 77% • of the responses were correct. • However, proper axial/equatorial analysis was critical • for 4 of those 6 questions, and for those, the average was • somewhat lower – 68%.
Conclusions 3/3 • Using a data-driven approach can work in organic chemistry. • Students rise to the challenge of guided inquiry. • Substitution and Elimination are still difficult concepts!
Thank you! This presentation is available at http://www.stolaf.edu/depts/chemistry/bh/bcce20