Download
1 / 16
200 likes | 699 Views
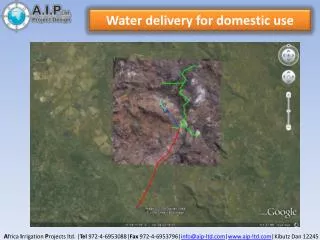
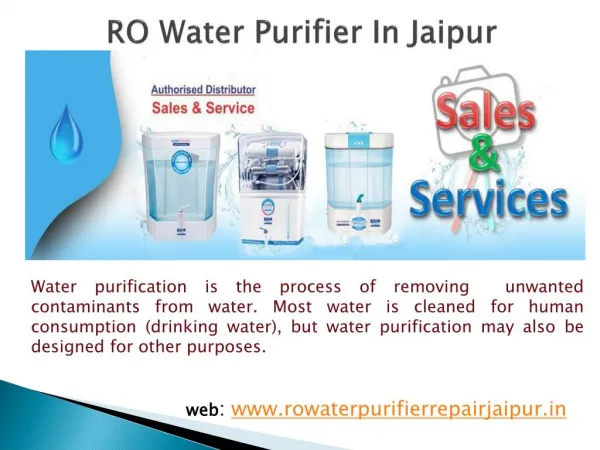
Domestic Water Carriers. Significance of the Industry. Transport roughly 14% of total national freight 26.5% of total domestic ton-miles Employ close to 200,000 Average compensation = 47,000. Types of Carriers. Private Carriers Cannot be hired

E N D
Significance of the Industry • Transport roughly 14% of total national freight • 26.5% of total domestic ton-miles • Employ close to 200,000 • Average compensation = 47,000
Types of Carriers • Private Carriers • Cannot be hired • Only transport freight of company that owns/lease the vessel
Types of Carriers • For-Hire Carriers • Charge fee for their service • Exempt from economic regulation when transporting dry & liquid bulk commodities • Vast majority of freight transported meets this definition • Hence, most of the for-hire carriers are exempt
Types of Carriers • Regulated For-Hire Carriers • Economic regulation administered by the STB • Only about 300 carriers • Classified as either common or contract carriers
Types of Carriers • Internal Carriers • Operate on U.S. Rivers & lakes (primarily the Great Lakes) • Principal waterways (rivers) • Mississippi • Ohio • Tennessee • Columbia • Hudson • Tenn-Tom Waterway
Types of Carriers • Costal Carriers • Operate along coasts (Atlantic, Pacific, & Gulf of Mexico) • Use oceangoing vessels primarily • Some oceangoing barges used (18,000 ton capacity)
Distribution of Ton-Miles • Exempt, For-Hire • Coastal = 34.7% • Internal = 58.3% • Great Lakes = 7.0% • Regulated, For-Hire • Coastal = 25.5% • Internal = 56.9% • Great Lakes = 17.6% • Private • Coastal = 87.0% • Internal = 10.1% • Great Lakes = 2.7%
Domestic Ton-Miles by Type of Service • Exempt, For-Hire = 73.1% • Regulated, For-Hire = 4.5% • Private = 22.4%
General Service Characteristics • Commodities Hauled • Dry bulk (coal & coke) = 28.3% • Petroleum (& related) = 24.4% • Food & farm = 14.4% • Chemicals = 8.4% • Iron ore, iron & steel = 4.7% • All other = 19.8%
General Service Characteristics • Length of Haul • Internal carriers average haul 482 miles • Great Lakes carriers average 508 miles • Coastal average 1652 miles • Load Size • Barges normally transport 1000 – 1500 tons (max capacity 3000 tons) • Equivalent to 16 railcars or 60 trucks • Great Lakes carriers average 20,000 tons
General Service Characteristics • Low-Cost Service • Primary advantage • Lowest cost mode for shipment of non-liquid products (1997 averages below) • Barge per-ton fees = $0.73 • Rail per-ton fees = $2.40 • Truck per-ton fees = $26.12 • Oil pipelines per-ton fees = $1.37
General Service Characteristics • Speed of Service • Transit time longest of the 4 modes that move non-liquids • Speeds average between 5 – 10 miles per hour (upstream vs. downstream) • Service Disruption • Ice • Hurricanes
Types of Vehicles • Tanker • Largest ship in domestic water industry • 18,000 – 50,000 tons • Barge • Most commonly used vessel by internal waterway carriers • Powerless (towed by a tugboat) • 1500 – 3000 tons
Terminals • Most often provided by the public • Local government agencies operate ports and storage facilities • Some private firms invest in own terminals • Grain, coal, oil • Containerization critical
Cost Structure • Approximately 15% of costs are fixed • Remainder (85%) are variable • Labor represents approximately 20% of operating costs • Ships typically consume more fuel per mile than all the other modes (0.0128 miles per gallon) • Note that despite using more fuel on a per mile basis, water transporters use less overall fuel than other carriers • Thus, on a fuel per ton-mile basis, water is the most fuel-efficient