Download
1 / 32
320 likes | 568 Views
Detection of QTL in beef cattle Eduardo Casas U.S. Meat Animal Research Center, Clay Center, Nebraska. DNA structure. Cell. Chromosome. Nucleosome. Double helix. Sequence. Microsatellites and Single Nucleotide Polymorphisms. Microsatellites. SNP. Alelle A. GAACT A GCTTGAC.

E N D
Detection of QTL in beef cattle Eduardo Casas U.S. Meat Animal Research Center, Clay Center, Nebraska
DNA structure Cell Chromosome Nucleosome Double helix Sequence
Microsatellites and Single Nucleotide Polymorphisms Microsatellites SNP Alelle A GAACTAGCTTGAC CCGTATCACACAGTCAAC Alelle B CCGTATCACACACACAGTCAAC GAACTGGCTTGAC
Microsatellites Dam 1 2 3 4 5 8 10 11 Sire Dam allele 1 Sire allele 1 Sire allele 2 Dam allele 2
Bovine Chromosome 2 (BTA2). (Kappes et al., 1997)
Quantitative trait loci (QTL) on bovine chromosome 5 BOVINE CHROMOSOME 5
Identification of QTL in cattle What have we used to identify QTL? What have we found? Where are we validating them?
Family from sire 921467 (BM) X X BM n= 245
Family from sire 921690 (PA) X PA X n= 209
Family from 906802 (Bonzo) X X n= 500
Family from 906801 (Blackie) X X n= 500
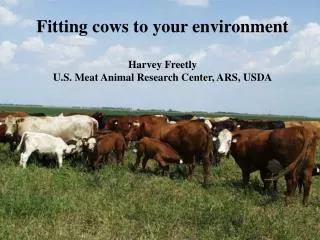
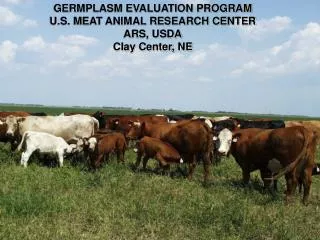
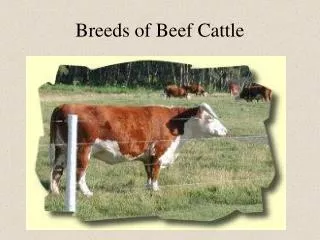
¼ Hereford ¼ Angus ¼ Pinzgauer ¼ Red Poll MARC III http://www.ansi.okstate.edu/breeds/index.htm
Traits measured Growth traits: - Birth weight (kg). - Weaning weight (kg). - Yearling weight (kg). - Postweaning average daily gain (kg/d). • Measured carcass traits: • - Hot carcass weight (kg). • - Fat depth (cm). • - Marbling score. • - Longissimus muscle area (cm2). • - USDA yield grade. • Est. kidney, pelvic, & heart fat (%). • Rib bone. • Ribfat. • - Ribmus. • - Warner-Bratzler shear force • 2 or 3 d postmortem (kg). • - Warner-Bratzler shear force • 14 d postmortem (kg). Predicted carcass traits: - Retail product yield (%). - Fat yield (%). - Bone yield (%). - Dressing percent (%).
Identification of QTL in cattle What have we used to identify QTL? What have we found? Where are we validating them?
GENOME SCAN RESULTS IN ALL RESOURCE FAMILIES BM Blackie Bonzo PA BTA1 BTA2 BTA3 BTA4 BTA5 MSTN WBS14 RPYD, FATYD FAT, YG, RPYD, WBS14 RIBBONE, DP, RIBFAT, BWT RPYD FATYD MARB, RPYD MARB MARB, RPYD MARB, RPYD Fat yield HCW, WBS3 BTA6 BTA8 BTA15 BTA27 BTA29 FAT, MARB FAT BWT, W365, HCW, LMA WBS14 WBS3, WBS14, Calpain MARB Dairy Form
Identification of QTL in cattle What have we used to identify QTL? What have we found? Where are we validating them?
25 % Piedmontese 75 % Piedmontese 50% Piedmontese Germplasm Evaluation, Cycle IV Dam line (n = 71) (n = 109) Sire line (n= 6) 52 ------- (n= 7) ------- 96 (n= 35) 35 41 PH (n= 5) 52 ------- PA (n= 5) ------- 47 Total (n= 6) 117 184
Germplasm Evaluation, Cycle V Dam: Hereford MARC III Angus F1 BB(F1) Ch(F1) n = 1551 (from 1998 to 1999) (Cundiff et al., 1998, 1999, 2000)
Germplasm Evaluation, Cycle V F2 subpopulation n = 154 (from 1998 to 1999) (Cundiff et al., 1998, 1999, 2000)
Germplasm Evaluation, Cycle VI Dam: Hereford MARC III Angus Sire: Hereford Angus Wagyu Norwegian Red Swedish Red & White Friesian F1 (N= 415) Ch(F1) n = 820 (from 2001 to 2002) (Cundiff et al., 1998, 1999, 2000)
Germplasm Evaluation, Cycle VII Sire: Hereford, Angus, Red Angus, Limousin, Charolais, Simmental, Gelbvieh Dam: Hereford MARC III Angus F1 n = 1400 (from 1999 to 2001) Approximately 600/year (from 2003 and on) F2 (Cundiff et al., 1998, 1999, 2000)
Germplasm Evaluation, Cycle VIII Sire: Hereford Angus Beefmaster Brangus Bonsmara Romosinuano Dam: Hereford MARC III Angus F1 n = 1200 (from 2001 to 2002) Terminal cross (Approximately 600/year) (Cundiff et al., 1998, 1999, 2000)
STARS Brahman cattle project 504 offspring samples obtained from 1995 to 1999 (Riley et al., 2002)
Calving Ease Selection (CE) Heifer Calving Difficulty Birth Weight EBV, lb
PA GPE IV BM GPE V Characterization of the variation of Myostatin (BTA2) in resource populations.
BH PA FAT, WBS14, and YG GPE VII REA, Marbling, FATYD Characterization of variation for QTL on BTA5 for carcass traits in resource populations.
BWT, WWT, LWT, ADG, HCW, and REA BM GPE VII Characterization of variation for QTL on BTA6 for growth and carcass traits in resource populations.
BM GPE VII MARBLING Characterization of variation for QTL on BTA27 for marbling in resource populations.
BH PA Tenderness GPE VII Tenderness Tenderness STARS Tenderness Characterization of variation for QTL on BTA29 for meat tenderness in resource populations.
Blackie Bonzo GPE VI GPE IV GPE V GPE VII GPE VIII Calving Ease STARS Characterization of QTL variation in resource populations. PA BM