Download
1 / 3
40 likes | 59 Views
From 2018.11 to 2019.11, total export volume of Glutathione from China was 375,919,761KG while<br>total export value was $1,785,637,577. The biggest proportion of exporting volume in the last<br>12 months was 9.09% in 2019.03

E N D
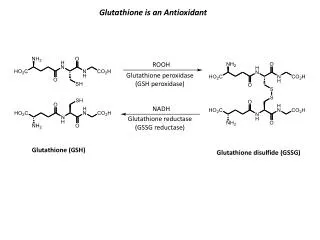
What is Glutathione CAS No: 70-18-8 Formula: C10H17N3O6S Synonyms: Glycine,L-γ-glutamyl-L-cysteinyl-;Glutathione;Glycine,N-(N-L-γ-glutamyl-L-cysteinyl)-;L-γ -Glutamyl-L-cysteinylglycine;-L-Glutamyl-L-cysteinylglycine;Glutathione-SH;GSH;L-Glutathione; Reduced glutathione; Triptide;Glutide;Tathion;Tathione;Copren;Deltathione;Glutathion;Glutinal; Isethion;Neuthion;Agifutol S; γ -Glutamylcysteinylglycine;N-(N-L-Glutamyl-L-cysteinyl) glycine;Bakezyme RX;ReadiSorb;Atomolan;High Thione Extract YH15;N5-((R)-1- ((Carboxymethyl) amino)-3-mercapto-1-oxopropan-2-yl)-L-glutamine;TAD 600 China Export: From 2018.11 to 2019.11, total export volume of Glutathione from China was 375,919,761KG while total export value was $1,785,637,577. The biggest proportion of exporting volume in the last 12 months was 9.09% in 2019.03. Categories: Pharmaceutical Intermediates > Antineoplastics Request for Quotation China Glutathione Export Data Data referenced from General Administration of Customs,P.R.China 2018.11-2019.11 China Glutathione Export Data From 2018.11 to 2019.11, total export volume of Glutathione from China was 375,919,761KG while total export value was $1,785,637,577. The biggest proportion of exporting volume in the last 12 months was 9.09% in 2019.03. 2018.11-2019.11 TOP10 Purchasing Countries' Export Data of Chinese Glutathione From 2018.11 to 2019.11, China has exported Glutathione to 125 countries in total. Country ranks by import volume from high to low is India, America, Korea, Brazil, Thailand, Mexico, Japan, Taiwan, Indonesia, Belgium. The highest export volume was China to India, accounting for 6.80% of the total volume of China.
Check Export Data for More Purchasing Countries Export Export Volume(KG) Volume(KG) Export Export Percentage Percentage Export Export Value($) Value($) Purchasing Purchasing Country Country India 43,690,504 6.80% 179,476,626 America 39,096,711 6.08% 340,668,100 Korea 28,241,437 4.39% 116,644,964 Brazil 24,921,775 3.88% 174,848,049 Thailand 20,799,994 3.23% 46,331,256 Mexico 18,787,920 2.92% 42,033,639 Japan 18,279,228 2.84% 92,861,257 Taiwan 18,227,810 2.83% 75,304,479 Indonesia 15,807,201 2.46% 49,407,863 Belgium 14,736,053 2.29% 45,331,798 Russia 10,566,626 1.64% 27,874,333 Vietnam 9,544,760 1.48% 26,442,346 Malaysia 8,130,742 1.26% 18,300,287 Germany 7,363,747 1.15% 41,901,193 Singapore 6,875,921 1.07% 19,907,146 Hongkong 6,745,089 1.05% 17,686,075 Pakistan 6,610,917 1.03% 35,511,723 Netherlands 5,264,030 0.82% 40,468,218 Turkey 5,136,819 0.80% 22,000,094 Israel 5,012,007 0.78% 50,331,647 Italy 4,713,989 0.73% 32,312,673 Australia 4,500,786 0.70% 16,698,459 Colombia 3,935,203 0.61% 21,053,646 Argentina 3,878,620 0.60% 42,704,225 Canada 3,576,968 0.56% 8,183,144
Philippines 3,245,943 0.50% 9,472,845 Bangladesh 2,568,340 0.40% 5,177,902 France 2,474,444 0.38% 23,926,646 Chile 2,412,150 0.38% 5,778,093 Peru 2,355,522 0.37% 4,658,837