Download
1 / 98
1k likes | 1.03k Views
Intensity Transformation and spatial Filtering<br>Some basic intensity Transformation Functions<br> Image Negatives<br>Log Transformations<br>Power -Law (Gamma) Transformations<br>Piece wise-Linear Transformation Functions<br>Histogram Processing <br> * Histogram Equalization<br> *Histogram Matching <br> *Histogram Processing

E N D
Chapter 3. Intensity Transformation and Spatial Filtering R.LakshmiMCA.,B.Ed., M.Phil., Assistant Professor , Department of Information Technology E.M.G.YadavaWomens College Madurai-14
Spatial Domain vs. Transform Domain • Spatial domain image plane itself, directly process the intensity values of the image plane • Transform domain process the transform coefficients, not directly process the intensity values of the image plane
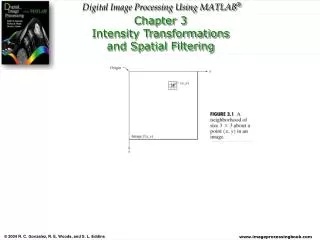
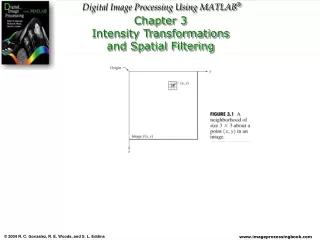
The neighborhood with origin at (x,y) in f for example suppose the The neighborhood is square of the size 3 X 3 and operator T is Defined as :Computer the average intensity of the neighborhood” . . Spatial filtering is a process by which we can alter properties of an optical image by selectively removing certain spatial frequencies that make up an object, for example, filtering video data received from satellite and space probes, or removal of raster from a television picture or scanned image. Spatial filtering is commonly used to "clean up" the output of lasers, removing aberrations in the beam due to imperfect, dirty, or damaged optics, or due to variations in the laser gain medium itself.
Intensity Transformation • 1 x 1 is the smallest possible neighborhood. • In this case g depends only on value of f at a single point (x,y) and we call T an intensity (gray-level mapping) transformation and write s = T(r) where r and s denotes respectively the intensity of g and f at any point (x, y).
Image Negatives Denote [0, L-1] intensity levels of the image. Image negative is obtained by s= L-1-r
Log Transformations s = clog(1+r), c – const, r ≥ 0 Maps a narrow range of low intensity values in the input into a wider range of output levels. The opposite is true for higher values of input levels.
Power–Law (Gamma) transformation s = crγ, c,γ –positive constants curve the grayscale components either to brighten the intensity (when γ < 1) or darken the intensity (when γ > 1).
Example: Gamma Transformations Cathode ray tube (CRT) devices have an intensity-to-voltage response that is a power function, with exponents varying from approximately 1.8 to 2.5
Piecewise-Linear Transformations • Contrast Stretching — Expands the range of intensity levels in an image so that it spans the full intensity range of the recording medium or display device. • Intensity-level Slicing — Highlighting a specific range of intensities in an image often is of interest.
Contrast stretching Contrast stretching is a process that expands the range of intensity levels in a image so that it spans the full intensity range of the recording medium or display device. Contrast-stretching transformations increase the contrast between the darks and the lights
Highlight the major blood vessels and study the shape of the flow of the contrast medium (to detect blockages, etc.) Measuring the actual flow of the contrast medium as a function of time in a series of images
Intensity-level slicing Highlighting a specific range of gray levels in an image
Histogram processing The histogram of a digital image with gray levels in the range [0, L-1] is a discrete function h(rk)=nk, where rk is the kth gray level and nk is the number of pixels in the image having gray level rk. It is common practice to normalize a histogram by dividing each of its values by the total number of pixels in the image, denoted by the product MN. Thus, a normalized histogram is given by h(rk)=nk/MN The sum of all components of a normalized histogram is equal to 1.
Histogram Equalization • Histogram equalization can be used to improve the visual appearance of an image. • Histogram equalization automatically determines a transformation function that produce and output image that has a near uniform histogram
Histogram Equalization • Let rk, k[0..L-1] be intensity levels and let p(rk) be its normalized histogram function. • The intensity transformation function for histogram equalization is
Histogram Processing • Histogram Equalization • Histogram Matching • Local Histogram Processing • Using Histogram Statistics for Image Enhancement
Example: Histogram Equalization Suppose that a 3-bit image (L=8) of size 64 × 64 pixels (MN = 4096) has the intensity distribution shown in following table. Get the histogram equalization transformation function and give the ps(sk) for each sk.
Question Is histogram equalization always good? No
Histogram Matching Histogram matching (histogram specification) — generate a processed image that has a specified histogram
Histogram Matching: Procedure • Obtain pr(r) from the input image and then obtain the values of s • Use the specified PDF and obtain the transformation function G(z) • Mapping from s to z