Download

1 / 6
0 likes | 1 Views
The Bioscan is an esteemed International Quarterly Journal of Life Sciences, dedicated to publishing high-quality, peer-reviewed research across all areas of life sciences. Our distinguished international editorial board comprises leading experts committed to upholding rigorous scientific standards and ensuring impactful, credible research.

E N D
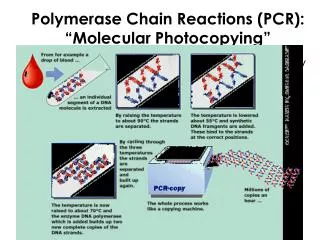
17(1) : 01-05, 2022 Trichoderma plenipotentis var. globosporioides pensz. Molecular Characterization by RAPD and ITS-PCR Against Colletotrichum glycosporioides pensz. Rani, Mr. Narendre KEY WORDS Mango Anthracnose Colletotrichum gloeosporioid Trichoderma RAPD,ITS-PCR ABSTRACT Genetic variability among the isolates of Trichoderma spp. against Colletotrichum gloeosporioides (Penz.) Penz. and Sacc. was studied using molecular techniques like RAPD and ITS-PCR. The RAPD banding pattern reflected the genetic diversity among the isolates with the formation of three clusters. ITS region of rDNA amplification with genus specific ITS1 and ITS4 universal primers produced products that varied in size from 566 to 657 bp in all the isolates. These results indicated polymorphism at ITS region of rDNA among the isolates of Trichoderma. Received on : 17.08.2009 Accepted on : 21.12.2009 *Corresponding author diagnosis of potential biocontrol agents in future. Thus, the present study was undertaken to assess the significant genetic variations by nucleic acid based marker techniques using RAPD and ITS-PCR to distinguish the genetic variability in nine isolates of Trichoderma spp. evaluated against Colletotrichum gloeosporioides. INTRODUCTION Mango (Mangifera indica L.) is considered as one of the most popular fruits among millions of people grown throughout the tropics and subtropics worldwide. India is the world’s largest producers, shares around 56 per cent of total global production (Chadha, 2001) and Andhra Pradesh ranks first in production (45.89 lakh tonnes). Mango is affected by large number of fungal pathogens. Among which, Colletotrichum gloeosporioides causes anthracnose, which is the most important biological constraint to mango production in Southeast Asia resulting in substantial yield loss (Dodd et al., 1991). Trichoderma species have been investigated as biological control agents (BCAs) for over 70 years (Hjelijord et al., 1998), but it is only recently that strains have become commercially available. Knowledge concerning the behaviour of these fungi as antagonists is essential for their effective use since they can act against target organisms in several ways (Jeffries et al., 1994) by producing extracellular enzymes (Haran et al., 1996) antifungal antibiotics (Ghisalberti et al., 1993) and also be competitors to fungal pathogens (Simon et al., 1989). Of late, molecular techniques are gaining importance in characterization and diagnosis of microbial population. Molecular characterization and identification of biocontrol isolates of Trichoderma spp. has been reported by several researchers (Hermosa et al., 2000 and Venkateswarulu et al., 2008). These techniques are not influenced by environment, independent of growth stage and reproducible when compared to conventional methods and helps in identification of antagonists which can be used as markers in The molecular variability among the isolates of Trichoderma spp. having different degrees of antagonistic activity against C.gloeosporioides incitant of mango anthracnose was studied by using random amplified polymorphic DNA (RAPD) and ITS region of rDNA. Fungal cultures Mycelial discs of 5 mm diameter Trichoderma isolates were cut from periphery of an actively growing 7 day old culture on PDA and inoculated on 250 mL conical flask containing 100 mL of sterile potato dextrose broth. The flasks were kept rotated constantly at a speed of 125 rpm in an orbital shaker at 28±2 C. The resultant growth of mycelial mat was harvested and excess moisture was completely removed through sterile blotting paper and used for DNA extraction. DNA extraction from Trichoderma isolates The total genomic DNA from different isolates of Trichoderma was extracted from vegetative mycelium using the procedure adopted by Reader and Broda (1985). Mycelial mat of 200 mg was grounded in the pre-sterilized pestle and mortar with liquid nitrogen until fine powder was obtained. About 50 mg of 1
K. GIRIDHAR KUMAR et al., freeze-dried ground mycelium in an eppendorf tube was resuspended in 500 µL of extraction buffer. To this 350 µL of phenol and 150 µL of chloroform was added and thoroughly mixed. The suspension was centrifuged at 13000 rpm for 1 hr. The upper aqueous phase was transferred to a new eppendorf tube. To this, 25 µL of RNAse (10%) was added and incubated to 37°C for 30 min. The solution was extracted with chloroform isoamylalchohol (24:1). The upper phase was transferred to an eppendorf tube and 0.54 volume (270 µL) of isopropanol was added and mixed thoroughly by inverting the tubes. DNA precipitated visibly into lump was observed. The tube was spun at 12,000 rpm for 10 min to pellet the DNA and the remaining liquid was removed. The pellet was rinsed with 70 percent ethanol two times, dried under vaccum and resuspended in 100 µL TE buffer (pH 8.0). The DNA samples were stored at -20 C for further studies. Qualitative and quantitative verification of DNA The quality and quantity of DNA was analyzed by running 2 µL of each sample mixed with 2 µL of 10x loading dye in 0.8% agarose gel. The DNA from all isolates produced clear sharp bands in one percent agarose gel indicating the good quality of DNA. The DNA has been quantified by comparing with the marker (Genei, Bangalore). RAPD profiles through polymerase chain reaction (PCR) Five different random primers viz., OPA-03, OPA-05, OPA- 08, OPA-09 and OPA-10 (Operon technologies Inc.,) were screened for generating polymorphism among the isolates under the study. The experiment was repeated thrice and results were reproducible. The primer sequence used in RAPD technique are given as below: pattern of each isolate was evaluated, assigning character state ‘I’ to all the bands that could be reproducible and detected in the gel and ‘O’ for the absence of band. The data matrix thus generated was used to calculate Jaccard similarity coefficient for each pair wise comparison. The coefficients were calculated In Silico following Jaccard (1908). The similarity coefficients were subjected to Unweighted Pair-Group Method on Arithmetic Average (UPGMA) cluster analysis to group the isolate based on their overall similarities. Statistical Package for Social Science (SPSS) package was used for the cluster analysis and subsequent dendogram preparation. PCR amplification of ITS region PCR amplification of ITS (Internal Transcribed Spacers) region of rDNA was performed using universal primers ITS-1 (5' – TCC GTA GGT GGA CCT GCG G – 3') as forward primer and ITS-4 (5' – TCC TCC GCT TAT TGA TAT GC – 3') as reverse primer (White et al., 1990) in eppendorf PCR master cycler. Amplification was carried out in 0.2 mL eppendorf tubes with 25 µL reaction mixture containing 2.5 µL of 10 x Taq buffer, 2 µL of 25 mM Mgcl2, 0.5 µL of ITS-1 primer (25 picomolar/ µL), 0.5 µL of ITS-4 primer (25 picomolar/ µL), 0.5 µL of 100 mM dNTP mix, 0.5 µL of Taq polymerase (3 U/µL) and 15.5 µL of sterile PCR water (Genei, Bangalore) and 3 µL (30-40ng) of DNA sample. The PCR amplification was carried out by 35 cycles, of which denaturation at 94°C for 1 minute, annealing at 56°C for 1 minute and extension at 72°C for 1.5 minutes with initial denaturation at 94°C for 4 minutes before cycling and final extension at 72°C for 6 minutes after cycling. Amplified PCR products were observed in 1.0 per cent agarose gel in 1% TBE buffer and visualized under trans-illuminator with ethidium bromide staining. The size of the PCR product was estimated by comparison with known DNA marker of 1 kb DNA ladder. The banding profiles of ITS-PCR products were documented in gel documentation system (Alpha Innotech). S.No. Name of the primer 1. OPA-03 2. OPA-05 3. OPA-08 4. OPA-09 5. OPA-10 PCR amplifications were carried out in 0.2 mL eppendorf tubes with 25 µL reaction mixture which consists of 2.5 µL of 1 x Taq buffer, 2 µL of 25 mM Mgcl2, 4 µL of primer (25 picomolar / µL), 0.5 µL of 100 mM dNTP mix, 0.6 µL of Taq polymerase enzyme (conc. 3U µL-1) and 13.4 µL of sterile PCR water (Genei, Bangalore) and 2 µL (20-25 ng) of DNA sample. Amplification was carried out by 5 minutes of initial denaturation of 94°C followed by 45 cycles (Sreenivasaprasad et al., 1992) of denaturation of 94°C for 1 minute; annealing at 37°C for 1 minute; extension at 72°C for 2 minutes with final elongation at 72°C for 5 minutes. Amplified PCR products were subjected to 1.0 per cent agarose gel electrophoresis with 1.0 x TBE as running buffer. The banding patterns were visualized under UV trans-illuminator with ethidium bromide (1 mg mL-1) staining. The DNA banding profiles were documented in the gel documentation system (Alpha Innotech) and compared with 1 kb DNA ladder (Genei, Bangalore). Sequence 5' – AGT CAG CCA C – 3' 5' – AGG GGT CTT G – 3' 5' – GTG ACG TAG G – 3' 5' – GGG TAA CGC C – 3' 5' – GTG ATC GCA G – 3' Total genomic DNA extracted from the isolates produced clear sharp bands indicating the good quality of DNA. Characterization of Trichoderma isolates by RAPD Five random primers viz., OPA-3, OPA-5, PA-8, OPA-9 and OPA-10 generated reproducible polymorphism among the nine isolates of Trichoderma. Amplified products with all the primers showed polymorphic and distinguishable banding pattern indicating the genetic diversity among all isolates of Trichoderma. A total of 119 reproducible and scorable polymorphic bands ranging approximately as low as 75 bp to as high as 2500 bp were generated with five primers among the nine Trichoderma isolates characterized. The Trichoderma isolates T1 and T7 were identified as Trichoderma koningii (T1) (accession no. 6623) and Trichoderma fasciculatum (T7) (accession no. 6624) respectively at IARI, New Delhi. All the five primers produced unique bands in case of T.koningii (Isolate T1). Primer OPA-3 amplified a single fragment of approximately 300 bp in case of T2 isolate and 710 in case of T6 isolate (Fig 1A). All the five primers amplified similar fragments in case of T and T isolates, except for an 850 bp fragment by OPA-3 in case of T4 indicating Scoring and data analysis Each amplified band was considered as RAPD marker and recorded for all samples. Data were entered using a matrix in which all observed bands or characters were listed. The RAPD 3 4 2
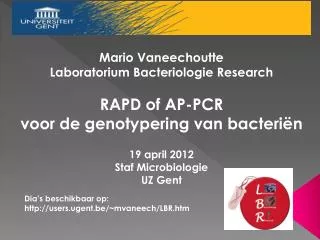
MOLECULAR CHARACTERIZATION OF TRICHODERMA SPP. Figure 1: A-E. Random Amplified Polymorphic DNA (RAPD) patterns of nine Trichoderma isolates with five random primers viz., A – OPA 3; B – OPA 5; C- OPA 8; D – OPA 9; E – OPA 10; M – 1 kb DNA ladder; Lanes 1 to 9 represent Trichoderma isolates T1 to T9 respectively the homogenicity of their genomes. primer OPA-8 amplified a unique band of 800 bp in case of T.fasciculatum (Isolate T7) and 1050 bp in case of T9 and 850 bp in case of T6 and T8 isolates (Fig 1C). Primer OPA-10 amplified a unique band of approximately 1400 bp in case of T5 and an 1800 bp band in case of T6 and T8 (Fig 1E). Relationship among the isolates were evaluated by cluster analysis of data based on similarity matrix. The dendogram (Fig 2) was generated using UPGMA package based on Ward’s Squared Equalidean Distance method. Based on the results obtained, all the nine isolates were grouped into three main clusters. Cluster I contains four isolates viz., T , T , T.fasciculatum and T9 of which the first two and last two forms two separate sub-clusters viz., Ia and Ib. Clusters II contains four isolates viz., T , T , T and T , of which the first three forms 2 5 6 a separate sub-cluster viz., Ia and T8 isolate alone forms a separate sub-cluster Ib. Cluster III contains only one isolate T. koningii indicating its genetic difference with other isolates. 3 4 8 3
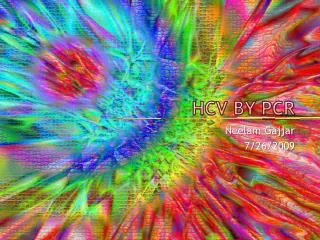
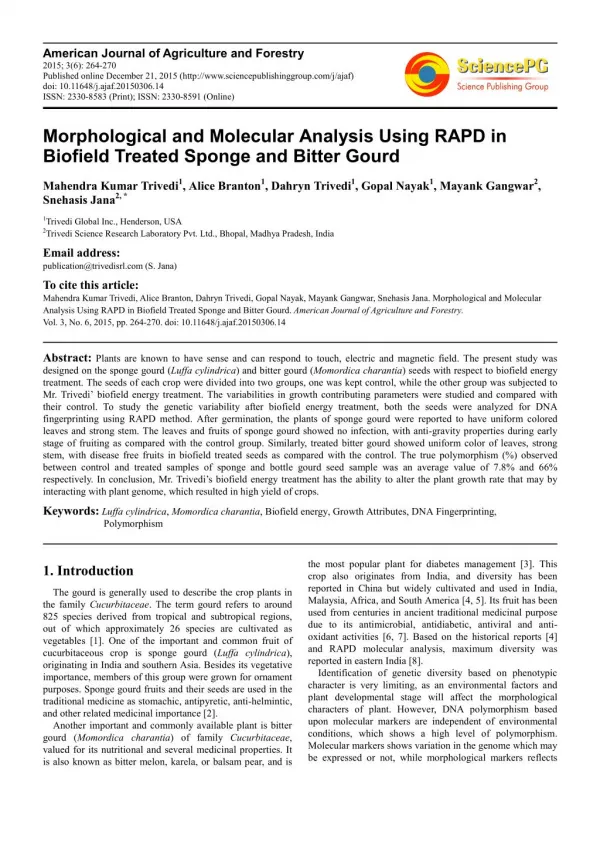
K. GIRIDHAR KUMAR et al., 3 T3 4 T4 6 T6 8 T8 2 T2 5 T5 7 T7 9 T9 T1 1 Figure 2: Dendogram generated using UPGMA analysis showing polymorphism between isolates of Trichoderma spp. using RAPD markers ITS 1 18 S 5. 8 S 28 A ITS 4 ITS 1 ITS 4 Figure 3: Structure of rDNA cluster and the position of ITS primers used in the PCR amplification of Trichoderma isolates Jaccard’s similarity co-efficient among the nine Trichoderma isolates were calculated to establish their genetic relationships. The similarity index values ranged from 0.00 to 100% indicating the presence of a high range of variability at nucleic acid level among the nine Trichoderma isolates. It is worthwhile to screen more number of RAPD primers belonging to different operon series in order to generate more polymorphism among the isolates. This study may help in tagging of the RAPD fragment to its antagonistic activity. Characterization of Trichoderma isolates by ITS-PCR Genus specific target primers viz., ITS-1 and ITS-4 were used for PCR amplification of ITS region of rDNA cluster which includes ITS-1, 5.8S and ITS-2 regions of all the nine isolates. The structure of rDNA and the expected amplified products with primers are shown in Fig 3. Amplified products size varies approximately in the range of 566 to 657 bp in all the isolates under the study. However, in case of T.koningii (Isolate T1) and T.falsicatum (Isolate T7) the size of the band obtained was 657 bp and 603 bp respectively (Fig 4). The results were in accordance with Latha et al., (2002) who reported the size of bands obtained with ITS-1 and ITS-4 primer pairs in case of all Trichoderma isolates was around 600 bp. These results confirmed that all the isolates belong to the genus Trichoderma. Similar results were reported by Muthumeenakshi et al., (1994), Ospina (1999) and Lieckfeldt (1999), who observed that the amplified rDNA fragment of approximately 500 to 600 bp by ITS-PCR in Trichoderma. The ITS-PCR has helped to detect polymorphism at ITS region of rDNA among the Trichoderma isolates. But based on these results it is not possible to conclude that all the isolates are the same. Digestion analysis of amplified ITS region with different restriction enzymes may reveal more polymorphism. Finally, sequencing of the amplified ITS region will help to know the differences at rDNA level among the isolates under study. The sequence information allows in developing a SCAR marker for Trichoderma koningii and Trichoderma fasciculatum, the Figure 4: Amplification product of Internal Transcribed Spacer (ITS) with ITS-1 and ITS-4 ribosomal DNA primers. M–1 kb DNA Ladder; Lanes 1 to 9 represent Trichoderma isolates T1 to T9 respectively. The arrows indicate the ITS-PCR bands specific for T.koningii and T. fasciculatum 4
MOLECULAR CHARACTERIZATION OF TRICHODERMA SPP. potential native antagonist against Colletotrichum gloeosporioides causing mango anthracnose. In this direction the future line of research work will be focused. JACCARD, P. 1908. Nouvelles recherches sur la distribution florale. Bull. Soc. Vaudoise Sci. Nat. 44: 223–270. Latha, J., Verma, A. and Mukherjee, K. P. 2002. PCR fingerprinting of some Trichoderma isolates from two Indian type culture collations – need for reidentification of these economically important fungi. Curr. Sci. 83(4): 372-374. Lieckfeldt, E., Samules, G. J., Helgard, I., Nirenderg and Petrini, O. 1999. A morphological and molecular perspective of T.viride is one or two species? Appl. Environ. Microbiol. 65(6): 2418-2428. Muthumeenakshi, S., Mills, P. R., Brown, A. E. and Seaby, D. A. 1994. Intraspecific molecular variation among T.harzianum isolates colonizing mushroom compost in the British Isles. Microbiology. 140(4):769-777. Ospina, M. D., Royse, D. J., Chen, X. and Romaine, C. P. 1999. Molecular phylogenetic analysis of biological control strains of T.harzianum and other biotypes of Trichoderma spp. Associated with mushroom green mold. Phytopathology. 89(4):313-317. Reader, U. and Broda, P. 1985. Rapid preparation of DNA from filamentous fungi. Lett. Appl. Microbiol. 1:17-20. Simon, A. and Sivasithamparan, K. 1989. Pathogen suppression: a case study of Gaeumannomyces graminis var. tritici in soil. Soil Biol. Biochem. 21: 331-337. Sreenivasaprasad, S., Brown, A. E. and Mills, P. R. 1992. DNA sequence variation and interrelationships among Colletotrichum spices causing strawberry anthracnose. Physiol. Mol. Pl. Pathol. 41:265-281. Venkateswarulu, R., Reddi Kumar, M., Eswara Reddy, N. P. and Sudhakar, P. 2008. Molecular characterization of Trichoderma spp. used against Fusarium wilt with PCR based RAPD and ITS-PCR. J. Mycology and Plant Pathology. 38(3): 559-563. White, T. J., Burns, T., Lee, S. and Taylor, J. 1990. Amplification and direct sequencing of fungal ribosomal RNA genes for phytogenetics. In PCR –Protocols and Applicaitons. A Laboratory Manual, (Innis, N., Gelfand, D., Sninsky, J., and White, T., Eds). Academic Press, New York, U.S.A, 315-322. ACKNOWLEDGEMENTS One of the authors are grateful to Prof. N. P. Eswara Reddy, Head, Dept of Plant Pathology, Sri Venkateswara Agricultural College, ANGRAU, Tirupati, for providing laboratory facilities and kind support during the course of these investigations. Dodd, J. C., Bugante, R., Koomen, I., Jeffries, P. and Jeger, M. J. 1991a. Pre and post harvest control of mango anthracnose in the Philippines. Plant Pathology. 40: 576-583. Chadha, K. L. 2001. Handbook of Horticulture, ICAR Publications, New Delhi, Inida. Ghisalberti, E. L. and Rowland, G. Y. 1993. Antifungal metabolites from Trichoderma harzianum. J. Nat. Prod. 561: 1799-1804. Haran, S., Schickler, H. and Chet, I. 1996. Molecular mechanisms of lytic enzymes involved in the biocontrol activity of Trichoderma harzianum. Microbiology. 142: 2321-2331. Hermosa, M. R., Grondona, I., Iturriaga, E. A., Dia-MinGuez, Castro, C., Monte, E. and Garcia-Acha, I. 2000. Molecular characterization and identification of biocontrol isolates of Trichoderma spp. Applied and Env. Microbiology. 66(5): 1890-1898. Hjeljord, L. and Tronsmo, A. 1998. Trichoderma and Gliocladium in biocontrol: an overview, In Kubicek, C. P. and Harman (Ed.) Trichoderma and Gliocladium. Taylor and Francis, Ltd., London, United Kingdom. p. 135-151. Jeffries, P. and Young, T. W. K. 1994. Interfungal parasitic relationships, CAB International, Wallingford, United Kingdom. p.296. 5
INSTRUCTION TO AUTHORS INSTRUCTION TO AUTHORS An International Quarterly Journal of Life Science Materials and Methods should include a brief technical description of the methodology adopted while a detailed description is required if the methods are new. Results should contain observations on experiment done illustrated by tables and figures. Use well known statistical tests in preference to obscure ones. Discussion must not recapitulate results but should relate the author's experiments to other work on the subject and give their conclusions. All tables and figures must be cited sequentially in the text. Figures should be abbreviated to Fig., except in the beginning of a sentence when the word Figure should be written out in full. The figures should be drawn on a good quality tracing/ white paper with black ink with the legends provided on a separate sheet. Photographs should be black and white on a glossy sheet with sufficient contrast. References should be kept to a minimum and listed in alphabetical order. Personal communication and unpublished data should not be included in the reference list. Unpublished papers accepted for publication may be included in the list by designating the journal followed by "in press" in parentheses in the reference list. The list of reference at the end of the text should be in the following format. JOURNAL The Bioscan is an international quarterly journal of life sciences with international editorial board. The journal is online and details can be seen (downloaded from the site. www.thebioscan.in). For any query e-mail at m_psinha@yahoo.com & dr.mp.sinha@gmail.com can be used. AIM & SCOPE The journal aims to publish original peerly reviewed/ refereed research papers/reviews on all aspects of life sciences. SUBMISSION OF MANUSCRIPT Only original research papers are considered for publication. The authors may be asked to declare that the manuscript has not been submitted to any other journal for consideration at the same time. Two hard copies of manuscript and one soft copy, complete in all respects should be submitted. The soft copy can also be sent by e- mail as an attachment file for quick processing of the paper. FORMAT OF MANUSCRIPT All manuscripts must be written in English and should be typed double-spaced with wide margins on all sides of good quality A4 paper. First page of the paper should be headed with the title page, (in capital, font size 16), the names of the authors (in capitals, font size 12) and full address of the institution where the work was carried out including e-mail address. A short running title should be given at the end of the title page and 3-5 key words or phrases for indexing. The main portion of the paper should be divided into Abstract, Introduction, Materials and Methods, Results, Discussion (or result and discussion together), Acknowledgements (if any) References and legends. Abstract should be limited to 200 words and convey the main points of the paper-outline, results and conclusion or the significance of the results. Introduction should give the reasons for doing the work. Detailed review of the literature is not necessary. The introduction should preferably conclude with a final paragraph stating concisely and clearly the aims and objectives of your investigation. 1. Witkamp, M. and Olson, J. S. 1963. Breakdown of confined and non-confined Oak Litter.Oikos. 14:138- 147. 2. Odum, E.P. 1971. Fundamentals of Ecology. W. B. Sauder Co. Publ. Philadelphia.p.28. 3. Macfadyen, A.1963. The contribution of microfauna to total soil metabolism. In:Soil organism, J. Doeksen and J. Van Der Drift (Eds). North Holland Publ. Comp., pp 3-16. References in the text should be quoted by the author's name and year in parenthesis and presented in year order. When there are more than two authors the reference should be quoted as: first author followed by et al., throughout the text. Where more than one paper with the same senior author has appeared in on year the references should Cont.......... P. 12 6