Download
1 / 6
0 likes | 11 Views
The in Bioscan is a prestigious International Quarterly Journal of Life Sciences dedicated to disseminating original and peer-reviewed research in the diverse fields of life sciences. Below is an overview of the journals

E N D
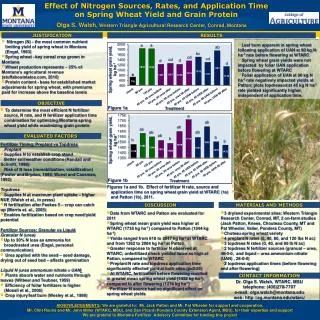
17(4): 01-06, 2022 www.thebioscan.com EFFECT OF INM ON NUTRIENTS UPTAKE AND YIELD OF MAIZE- WHEAT CROPPING SEQUENCE AND CHANGES IN NUTRIENT AVAILABILITY IN TYPIC HAPLUSTEPTS Madhavi,Kumari Department of Agricultural Chemistry and Soil Science, KEYWORDS Fertilizers Manure Cropping system Yield Uptake Balance Received on: 03.08.2022 ABSTRACT soil fertility without any risk to environment. Field experiments were carried out during 2014-15 and 2015-16 under the ongoing AICRP on LTFE with Maize-Wheat cropping in Typic Haplustepts that initiated during kharif 1997 at the Instructional Farm of Rajasthan College of Agriculture, Udaipur. The experiment consisted of 12 treatment combinations viz., T1- Control, T2- 100%N, T3- 100%NP, T4- 100%NPK, T5- 100%NPK + Zn, Accepted on: 14.11.2022 *Corresponding author skyrocketing prices of chemical fertilisers have prompted calls to augment these expensive inputs with more cost-effective organic and biological fertilisers (Kumar and Dhar, 2010). These biofertilizers are great for farmers since they are cheap, lightweight, and kind to the environment. Soils in Rajasthan are generally poor in organic matter content and nutrient supply; however, by introducing appropriate biological fertiliser strains to these soils, production can be enhanced via an increase in microbial population, which in turn increases nitrogen fixation and Meeting local food demands and maintaining food security are both supported by the maize-wheat farming system. Double cropping with maize (Zea mays L.) and wheat (Triticum aestivum L.) is the most common and well-known method under irrigated conditions in the northwest region of India. Historically, maize and wheat have been grown on oceans. According to Jat et al. (2013), the major crop rotation in India is still maize, which accounts for 1.8 million hectares and contributes around 3.0% of the country's food supply. In light of these considerations, the current research set out to determine how INM influences nitrogen absorption, yield, and variations in nutrient availability in Typic Haplustept soil, as well as the maize-wheat cropping sequence. analysis of variance (ANOVA) method to RBD. Whenever the 'F' test showed significance, the crucial difference (CD) at a 5% level was assumed (Panse and Sukhatme, 1985). The absorption of these nutrients by grain and straw was estimated by taking samples of each and analysing them. INTRODUCTION Improving fertiliser usage efficiency by matching soil nutrient availability with crop demand is the goal of Integrated fertiliser Management (INM), which is the concept of combined application of organic, inorganic, and biological nutrient sources (Graham et al., 2017). Divers' actions vary from those of integrated chemical fertiliser and organic input farmers, which is emphasised by modern agriculture technology (Tamilselvi et al., 2017). According to Nath et al. (2017), the soil microbiome and enzymes may be improved by varying amounts and types of crop waste, farmyard manure, and biological fertilisers. The fast depletion of soil micronutrients in India has been accelerated by intense cropping with nutrient exhausting high yielding cultivars and the use of high analysis fertiliser to enhance food grain production (Singh, 2009). Soil biological characteristics must be monitored for the long-term effects of inorganic fertilisers and integrated nutrient management strategies (inorganic fertilisers + organic amendments). Parkinson (2013) and Zhang et al. (2012) found that integrated nutrient management (INM) significantly increases crop yields while reducing nutrient losses to the environment and managing the nutrient supply. This leads to high resource-use efficiency, cost reductions, and improved nutrient availability. Therefore, INM is a viable model for agriculture to guarantee the safety of food and enhance environmental conditions globally, particularly in nations whose economies are undergoing fast development. phosphorus mobilisation. According to Rao and Reddy (2005), crop productivity was stabilised at low to medium cropping intensities by continuous FYM dressing, while under modern intensive farming, crop productiOn was stabilised by integrated organic and chemical fertilisers. The recent decline in soil health due to the global energy crisis and the 1
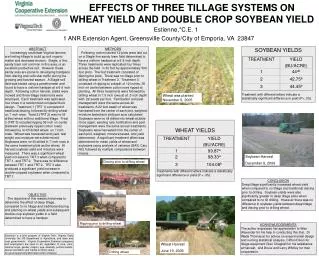
Yield Grain and stOver yield of maize -wheat crop as influenced by applicatiOn of INM (Organic manures + fertilizer applicatiOn) presented in (Table 1). A perusal Of data indicated that the grain and stOver yield of maize -wheat increased significantly with the incOrporatiOn of 100% NPK + FYM 10 t ha-1treatment (T9) Over cOntrol. The highest maize grain yield 4033 and 4053 kg ha-1and stOver yield 5290 and 5320 kg ha-1was recOrded under 100% NPK + FYM 10 t ha-1treatment (T ) during 2014-15 and 2015-16, respectively (Table 1). Similarly, the highest wheat grain yield 4939 and 5107 kg ha-1and straw yield 7217 and 7270 kg ha-1was recOrded under 100% NPK + FYM 10 t ha-1treatment (T ) during bOth years On poOled basis (Table 1). This might be due tO fact that In 2014–15 and 2015–16, the experiment took place at the Instructional Farm of the Rajasthan College of Agriculture in Udaipur. Located at 24°35′ N latitude and 74°42′ E longitude, the location is 579.5 m above mean sea level in the southeastern region of Rajasthan. The area is located in Rajasthan's agroclimatic zone IVa, which is the subhumid southern plain and the Arawali Hills. The region has a tropical climate, which means that summers are warm and associated with high humidity, especially from July to September. The majority of the 570-620 mm of precipitation that falls in the region each year falls in the southern and western monsoons from July through September. Summertime highs may reach 9 9 up tO 44°C and minimum temperature during December and January falls as lOw as 1°C. Initial status Of available nutrients applicatiOn of INM as integrative chemical fertilizers and in LTFE field during 1997 was clay lOam in texture having pH 7.45, EC 0.47 dSm-1, Organic carbOn 0.67%, available nitrogen 360.0 kg ha-1, available phosphorus 22.67 kg ha-1 and available potassium 671.15 kg ha-1and DTPA extract Zn, Fe, Cu and Mn values are 3.76, 2.52, 3.12, and 17.4 ppm, respectively. The experiment cOnsisted of 12 treatment cOmbinatiOns viz., T1- COntrol, T2- 100%N, T3- 100%NP, T4- 100%NPK, T5- 100%NPK + Zn, T6- 100%NPK + S, T7- 100%NPK + Zn + S, T8- 100% NPK + Azotobacter, T9- Organic manures applicatiOn was, however, fOund tO be quite promising not Only in maintaining higher productivity but alsO in providing greater stability in crop productiOn by synergistic effect Of FYM On improving efficiency of Optimum dose of NPK and cOrrective deficiency of Zn. The results Of the present study are in line with those reported by Behera and Singh (2010), Paradkar et al. (2010), Singh et al. (2014) and Kumar et al. (2014). Similarly results alsO showed that applicatiOn of 100 % NPK with Azotobacter seed treatment increased the 100% NPK + FYM 10 t ha-1, T - FYM 10 t ha-1+ 100%NPK yield of maize and wheat Over cOntrol. These are in 10 cOnfirmatiOn with findings Of Jaipaul et al. (2008). (-NPK Of FYM), T - 150%NPK and T - FYM @ 20 t ha-1with 11 12 fOur replicatiOns in a randomized blOck design. Maize variety PEHM-2 and wheat var. Raj-4037 was sOwn. The sOurces Nutrient contents in maize and wheat ApplicatiOn of INM brought abOut significant improvement in nitrogen, phosphorus and potassium cOntent in grain and stOver of maize and wheat during bOth the years Of used fOr applying N, P and K were urea, DAP (adjusted fOr its N cOntent) and muriate of potash, respectively. Gypsum and zinc sulphate (ZnSO 7H O) were used tO supply S and Zn 4. 2 research (two tables). Out of all the treatments, applying 100% NPK with FYM 10 t ha-1 resulted in the greatest improvement in the nitrogen, phosphorous, and potassium content in the grain and straw of wheat and maize. The amount of fertilisers applied and the concentration of nutrients close to the root zone determine how much of these nutrients plants absorb (Singh and Sarkar, 1985). The usage of organics in conjunction with chemical fertilisers may have increased the soil's nutrient supply after mineralization or decomposition, which explains why the concentrations of nitrogen, phosphorus, and potassium T7, which included applying 25 kg of ZnSO4 together with sulphur and 100% NPK, yielded the maximum zinc content in the grain and straw of wheat and maize, whereas T5, which involved applying 100% NPK and zinc, reached the lowest. All treatments with FYM as compared to control showed a substantial improvement in Zn content. In both years, the application of 100% NPK + FYM 10 t ha- 1 resulted in the maximum iron, copper, and manganese content in the grain and straw of wheat and maize. One possible explanation for FYM's favourable influence on micronutrient concentrations is the direct provision of these catiOns on in that order. Fertiliser made from Azotobacter sp. and farm yard manure, or FYM, were the two organic nutrient sources used. Each plot had soil samples taken before sowing and after harvest from two distinct depths (0–15 and 15–30 cm, respectively). For the purpose of analysing these samples, the following methods were used: the alkaline permanganate method (Subbiah and Asija, 1956), Olsen's method (Olsen et al., 1954), the ammonium acetate extractiOn method (Richards, 1954), and the atOmic absorption spectrophotometer (Lindsay and NOrvell, 1978) for the determination of available micronutrients (Zn, Cu, Fe, and Mn). Spectrophotometric estimates of nitrogen content were made in wheat (grain and straw) and maize (grain and stalk) using Nessler's reagent (Snell and Snell, 1959), whereas estimates of phosphorus content were made using Vanadom.The olybdate phosphoric acid yellow colour technique was developed by Jackson in 1973. The flame photometer method was also developed by Jackson in 1973. Linday and Norvell (1978) estimated the micronutrients (Fe, Mn, Cu, Zn) using AAS. have risen. But still, The experimental data were analyzed using analysis Of 2
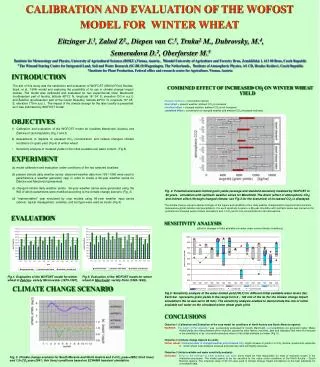
Table 1: Effect of INM on yield of maize and wheat under maize-wheat cropping system Treatments Maize yield (kg ha-1) Grain 2014-15 2015-16 Pooled 2014-15 2015-16 Pooled 2014-15 2015-16 Pooled 2014-15 2015-16 Pooled T1-Control 1327 1325 1326 2190 T2-100% N 2169 2112 2141 3500 T3-100% NP 2806 2829 2817 4090 T4-100% NPK 3220 3266 3243 4610 T5-100% NPK+Zn 3382 3390 3386 4790 T6-100%NPK+S 3297 3313 3305 4730 T7-100% NPK+Zn + S 3516 3530 3523 4870 T8-100% NPK+Azotobacter 3402 3400 3401 4910 T -100%NPK+FYM 10 t ha-14033 4053 4043 5290 T -FYM 10 t ha-1+100% 3490 3466 3478 4650 NPK (-NPK of FYM) T11-150% NPK 3605 3630 3618 5180 T -FYM 20 t ha-1 2435 2414 2425 3160 SEm± 91 93 65 151 CD (P = 0.05) 263 269 184 436 Wheat yield (kg ha-1) Grain Stover Straw 2200 3470 4140 4660 4820 4790 4920 4880 5320 4635 2195 3485 4115 4635 4805 4760 4895 4895 5305 4642 1552 2915 3591 4270 4495 4393 4592 4401 4939 4585 1609 3012 3620 4320 4520 4430 4610 4450 5107 4620 1326 2190 2141 3500 2817 4090 3243 4610 3386 4790 3305 4730 3523 4870 3401 4910 4043 5290 3478 4650 3618 5180 2425 3160 65 184 2200 3470 4140 4660 4820 4790 4920 4880 5320 4635 2195 3485 4115 4635 4805 4760 4895 4895 5305 4642 5250 3100 159 458 5215 3130 110 310 4640 3077 119 341 4680 3105 124 358 5250 3100 159 458 5215 3130 110 310 151 436 Table 2: Effect of INM on pooled nutrient contents in grain and stover of maize under maize-wheat cropping system Treatments Nitrogen (%) Phosphorus (%)Potassium (%) Grain Stover Grain Stover Grain T1 1.195 0.365 0.206 0.089 0.400 T2 1.365 0.397 0.238 0.113 0.425 T3 1.490 0.407 0.273 0.130 0.426 T4 1.474 0.473 0.283 0.131 0.442 T5 1.496 0.488 0.268 0.131 0.454 T6 1.530 0.498 0.251 0.126 0.465 T7 1.504 0.492 0.275 0.132 0.472 T8 1.597 0.492 0.280 0.144 0.476 T9 1.590 0.505 0.290 0.140 0.459 T10 1.552 0.488 0.277 0.140 0.467 T11 1.623 0.525 0.335 0.153 0.503 T12 1.390 0.420 0.267 0.128 0.440 SEm± 0.015 0.005 0.003 0.001 0.005 CD (P = 0.05) 0.042 0.014 0.008 0.004 0.014 Zinc (ppm) Iron (ppm) Copper (ppm) Manganese (ppm) Stover Grain 5.19 59.42 5.35 59.67 5.65 60.24 7.31 60.36 7.78 61.34 7.61 61.66 7.37 61.77 7.26 60.27 8.70 66.91 8.48 66.37 7.98 62.30 7.55 61.94 0.077 0.539 0.218 1.523 Stover Grain 1.098 1.335 1.344 1.373 1.353 1.348 1.355 1.370 1.369 1.417 1.494 1.265 0.015 0.041 Stover Grain Stover Grain 13.40 98 13.67 99 13.93 99 14.62 102 18.07 102 14.49 102 17.80 102 13.72 101 16.36 110 16.15 109 15.81 103 13.14 101 0.145 0.81 0.410 2.30 Stover 48.15 48.81 48.93 49.38 49.35 49.77 49.88 48.70 52.94 52.01 50.52 50.39 0.651 1.838 18.53 18.87 19.02 19.45 24.28 20.54 24.79 19.43 23.14 22.40 21.23 19.67 0.224 0.632 311 313 314 318 318 318 319 309 319 317 311 309 4.42 NS 8.72 8.99 9.52 10.43 10.81 9.64 10.31 11.46 12.74 12.54 11.22 11.76 0.079 0.224 Table 3: Effect of INM on pooled nutrient contents in grain and straw of wheat under maize-wheat cropping system Treatments Nitrogen (%) Phosphorus (%)Potassium (%) Grain Straw Grain Straw Grain T1 1.135 0.300 0.205 0.084 0.360 T2 1.270 0.312 0.232 0.086 0.376 T3 1.335 0.320 0.258 0.095 0.389 T4 1.381 0.372 0.273 0.101 0.396 T5 1.396 0.381 0.269 0.103 0.405 T6 1.350 0.376 0.264 0.096 0.407 T7 1.409 0.388 0.272 0.101 0.406 T8 1.397 0.382 0.260 0.102 0.411 T9 1.430 0.393 0.280 0.117 0.418 T10 1.389 0.386 0.272 0.114 0.414 T11 1.453 0.410 0.290 0.133 0.439 T12 1.340 0.339 0.267 0.120 0.407 SEm± 0.014 0.004 0.003 0.001 0.004 CD (P = 0.05) 0.039 0.011 0.011 0.002 0.012 Zinc (ppm) Grain 16.33 16.45 16.70 17.62 19.34 17.68 19.48 17.92 19.17 18.86 18.45 17.45 0.191 0.539 Iron (ppm) Grain Straw Grain Straw Grain 96 305 7.02 96 306 7.17 97 307 7.68 99 308 8.93 98 307 8.81 97 307 8.27 98 307 8.87 98 308 9.25 108 313 10.77 7.89 107 312 10.51 7.61 101 309 9.73 102 308 10.58 7.35 0.800 3.94 0.067 0.071 0.521 2.259 NS 0.189 0.199 1.470 Copper (ppm) Manganese (ppm) Straw 0.913 0.936 0.950 0.973 0.948 0.941 0.952 0.971 1.010 0.988 1.040 0.995 0.008 0.022 Straw 11.45 11.66 11.78 12.57 14.62 12.77 14.89 12.60 14.05 13.75 13.65 11.92 0.124 0.350 Straw 46.31 47.43 47.75 48.46 48.58 48.59 48.80 48.01 51.64 51.35 50.32 50.70 0.578 1.633 4.94 5.05 5.29 6.62 6.83 6.55 6.75 6.48 56.92 57.28 57.77 58.59 58.80 57.68 58.81 58.79 63.74 63.41 60.42 61.43 7.15 decomposition of FYM, which leads to mineralization and the solubilization of organic acids, and indirectly to FYM's beneficial impact on the soil environment. The results are consistent with those of Khan et al. (2006) and Roshani et al. (2005). Nutrient uptake by maize and wheat Results showing the impact of integrated nutrient management interventions on crop-specific nutrient absorption in grain and straw are shown in Table 4. Attained the maximum soluble nitrogen absorption by maize, which was 91.09 kg ha-1. 3
Table 4: Effect of INM on nutrients uptake (total) by maize under maize-wheat cropping system Treatments Nitrogen Phosphorus (kg ha-1) (kg ha-1) Maize Wheat Maize Wheat T1 23.86 24.97 4.69 5.20 T2 43.09 51.20 9.00 10.62 T3 58.75 65.43 13.04 14.43 T4 69.70 83.09 15.22 18.17 T5 74.08 88.16 15.35 18.95 T6 74.26 84.05 14.28 17.90 T7 77.09 91.31 16.14 19.43 T8 78.47 88.33 16.59 18.57 T9 91.09 100.23 19.13 22.25 T10 76.78 91.20 16.16 20.59 T11 86.05 94.05 20.07 22.03 T12 46.87 57.01 10.48 13.76 SEm± 1.38 1.980 0.313 0.403 CD (P = 0.05) 3.91 5.590 0.885 1.137 Potassium (kg ha-1) Maize 29.40 55.63 67.34 77.96 80.40 79.53 82.96 83.33 91.16 82.01 96.15 50.30 1.796 5.071 Zinc (g ha-1) Iron (g ha-1) Maize 8133 13008 15721 18036 18743 18508 19190 18544 21395 18547 19959 12104 381 1076 Copper (g ha-1) Manganese (g ha-1) Wheat Maize Wheat 27.07 540 52.02 880 65.29 1109 79.22 1308 81.01 1691 79.18 1369 83.49 1744 85.34 1333 93.15 1804 88.98 1531 90.67 1591 58.17 888 1.847 26 5.216 73 Wheat Maize Wheat Maize 8693 229 16240 379 20075 501 23989 677 24814 740 24299 681 25444 724 25672 746 28159 977 26956 829 24604 822 17305 521 523 11 1476 32 Wheat 1985 3768 4658 5616 5865 5707 6027 5924 6944 6545 6040 4221 110 310 527 997 1238 1561 1840 1612 1903 1665 1987 1838 1735 1086 36 101 172 324 420 599 618 589 647 641 813 770 685 505 45 128 1844 2978 3711 4245 4448 4407 4618 4435 5515 4725 4889 3078 74 208 Table 5: Effect of INM on available nutrients (pooled) after harvest of wheat under maize-wheat cropping system at different depth (cm) in soil Treatments Nitrogen Phosphorus Potassium (kg ha-1) (kg ha-1) (kg ha-1) Depth (cm) 0-15 15-30 0-15 15-30 0-15 15-30 T1 253 257 15.42 15.29 496 485 T2 266 269 15.61 15.38 479 471 T3 277 280 22.65 22.18 487 477 T4 347 348 23.41 23.14 549 552 T5 342 343 23.63 23.40 581 579 T6 342 344 24.38 24.19 554 549 T7 338 340 26.94 26.53 563 567 T8 375 376 26.74 26.30 558 552 T9 466 471 30.19 29.79 585 583 T10 402 404 25.79 25.36 595 591 T11 368 372 29.79 29.62 598 589 T12 304 308 24.45 24.19 581 578 SEm± 3.20 3.43 0.224 0.240 5.57 4.94 CD(P=0.05) 9.05 9.69 0.631 0.677 15.72 13.94 Zinc (ppm) 0-15 2.04 2.22 2.52 2.44 3.69 2.46 3.67 2.54 3.50 3.45 2.47 2.75 0.029 0.030 0.083 0.085 Iron (ppm) 0-15 2.59 2.67 3.07 2.95 3.11 3.30 3.47 3.26 3.72 3.55 2.88 2.95 0.032 0.089 Copper (ppm) 0-15 1.65 1.63 1.95 1.93 2.14 2.25 2.21 1.75 2.57 2.49 1.82 2.35 0.022 0.022 0.061 0.062 Manganese (ppm) 0-15 9.02 9.75 9.50 9.70 9.81 10.34 11.16 11.09 13.00 12.85 9.49 13.58 0.112 0.317 15-30 2.00 2.11 2.45 2.38 3.62 2.41 3.52 2.51 3.47 3.40 2.42 2.70 15-30 2.55 2.60 3.02 2.90 3.05 3.26 3.39 3.17 3.64 3.45 2.79 2.91 0.032 0.090 15-30 1.60 1.61 1.90 1.94 2.08 2.14 2.11 1.70 2.51 2.44 1.77 2.29 15-30 8.95 9.66 9.39 9.58 9.69 10.18 10.97 10.92 12.84 12.73 9.40 13.42 0.114 0.323 Table 6: Effect of different treatments on nutrient balance in soil during both maize-wheat cropping system (2014-15 and 2015-16) Treatments Nutrient addition through manure and fertilizers (kg ha-1) N P T1- Control 0 0 T2- 100% N 480 0 T3- 100 NP 480 240 T4- 100% NPK 480 240 T5- 100% NPK + Zn 480 240 T6- 100% NPK+ S 480 240 T7- 100% NPK+ Zn + S 480 240 T8- 100% NPK +Azotobacter 480 240 T - 100% NPK + FYM 10 t ha-1 576 268 T - FYM 10 t ha-1+100% NPK (-NPK of FYM) 480 240 T11- 150% NPK 720 360 T - FYM 20 t ha-1 192 72 12 Total nutrient uptake by maize-wheat sequence(kg ha-1) N P 97.25 19.78 188.57 39.26 248.36 54.96 305.58 66.8 324.49 68.61 316.63 64.38 336.79 71.13 333.61 70.32 382.64 82.76 335.97 73.48 360.20 84.18 207.75 48.5 Nutrient balance after completion of two years(kg ha-1) N P -97.65 -19.78 291.43 -39.26 231.64 185.04 174.42 173.2 155.51 171.39 163.37 175.62 143.21 168.87 146.39 169.68 193.36 185.24 144.03 166.52 359.80 275.82 -15.75 23.5 K 0 0 0 120 120 120 120 120 210 120 180 180 K 112.95 215.29 265.25 314.35 322.81 317.41 332.91 337.34 368.63 341.98 373.64 216.96 K -112.95 -215.29 -265.25 -194.35 -202.81 -197.41 -212.91 -217.34 -158.63 -221.98 -193.64 -36.96 as compared to other treatments, the application of 100% NPK + FYM was much superior. However, a 150% NPK application, followed by a 100% NPK + FYM treatment, resulted in the maximum P and K absorption in maize, at 20.07 and 96.15 kg ha-1, respectively. The peak performance Under 100% NPK + FYM application, followed by 150% NPK application, wheat uptaked 100.23 kg ha-1 of N, 22.25 kg ha-1 of P, and 93.15 kg ha-1 of K, respectively. At 1804, 21395, 977, and 5515 ppm, respectively, zinc, copper, iron, and manganese are the micronutrients that maize absorbs the most. 4
by wheat i.e. 1987, 28159, 813 and 6944 ppm respectively, was recOrded under integrated use of 10 t ha-1FYM and RDF i.e. 100% NPK. Zinc uptake under this treatment was at par with applicatiOn of 100% NPK + Zn + S (T7) and 100% NPK + Zn (T5). These facts due tO applicatiOns Of FYM not Only applicatiOn of 100% NPK + Zn + S applicatiOn. The availability alsO increased at bOth depths as cOmpared tO initial values. The highest available cOpper was recOrded with applicatiOn of 100% NPK+ FYM 10 t ha-1at bOth depths. ApplicatiOn of FYM@ 20 t ha-1recOrded the highest available sOlubilize the unavailable nutrients but alsO cOntains significant manganese in surface and subsurface sOils. The increase in quantity of nitrogen, phosphorus, potassium, and other micronutrients. Therefore, the use of FYM has led to a considerable improvement in nutrient absorption, with a marked decrease in the cost over a longer period of time. Maintaining increased productivity and ensuring steady crop yields for sustainable agricultural production may be achieved via the combined use of organic manure and chemical fertiliser. These findings corroborate those of Behera and Singh (2010), Das et al. (2010), and Sharma et al. (2013). Nutrient availability After the maize-wheat sequence was finished, the combined application of several plant nutrients greatly improved their status in the soil at the time of wheat harvest (Table 5). The application of 100% NPK+ FYM at a rate of 10 t ha-1 resulted in the maximum available nitrogen at both depths. Subsurface soils (15-30 cm) had the highest nitrogen availability values, which increased throughout INM treatments. Comparing the available nitrogen content in soil following wheat crop harvest during the experimental year to starting values, results revealed that higher nitrogen application improved the content. In comparison to other INM treatments, the application of 100% NPK+ FYM 10 t ha-1 and 150% NPK improved the availability of phosphorus at both depths. When comparing surface soils (0-15 cm) to subsurface soils (15-30 cm), the availability of phosphorus was found to be greater in the former. There was a significant increase in the available P status of the soil when phosphorus was applied at STR and 150% NPK, in comparison to when no phosphorus was applied. It is likely that the mobilisation of native soil phosphorus led to an increase in P availability, since the concentration of phosphorus in the soil rose with an increase in the amount of phosphorus. It is possible to enhance the availability of organic phosphorus via mineralization and acidification of the soil solution microenvironment when several nutrients are applied at available nutrient status Of sOil might be due tO microbial as well as chemical activities. An improvement in available nutrient status Of the sOil with the incOrporatiOn of chemical fertilizer cOuld be attributed tO cOnserved sOil nitrogen and increased availability of Other nutrients as being its cOnstituent as well as mineralize from the native sOurce in sOil. The results Of present investigatiOn are in line with the finding of Gill (2003). Nutrient balance There was a reduction in available nitrogen and an improvement or maintenance of phosphorus with INM treatments compared to the original values (Table 6). Regardless of the therapy, the available potassium contents dropped. Fertilisers, whether used alone or in combination with organic manure, significantly increased the amount of accessible nitrogen and phosphorus. When compared to nitrogen and potassium, phosphorus is immobile in soil. The lack of phosphorus in the fertilisation schedule is the obvious reason of a negative P balance, whereas the addition of phosphorus in excess of the crop's intake results in a positive P balance. Dwivedi et al. (2007) found results that are consistent with these findings. Indicative of commendable mining of available K, the trend of available K reducing from its original state was seen due to continuous farming. According to Swarup (2000), Thakur et al. (2011), and Kumar et al. (2013), this is in agreement. CONCLUSIONS The current study's findings suggest that wheat cv. Raj-4037 and maize cv. PEHM-2, which are classified as hyper-thermic Typic haplustepts of Udaipur, need 10 t ha-1 of FYM in conjunction with 100 % NPK (120 kg N, 60 kg P O, and 30 kg K O ha-1). 2 5 2 vitamin P. Applying 150% NPK increased the amount of potassium in surface oils to its maximum. The highest potassium availability, however, was seen in subsurface soils when applied at a rate of 100% NPK+ FYM 10 t ha-1. The higher potassium levels in the 150% NPK treatment are a result of the higher potassium application rates in this treatment. FYM is known to be a direct source of potassium and also helps to reduce leaching loss by retaining K+ ions on exchange sites and releasing potassium through organic matter interactions with clay. The results are consistent with those of other studies conducted in the country and overseas, including those by Totawat et al. (2001), Verma et al. (2005), Singh et al. (2013), and Meena et al. (2017). When compared to their starting points, the amounts of available zinc at both depths dropped. At 0–15 cm and 15–30 cm, respectively, the maximum DTPA–Zn concentrations were 3.69 and 3.62 ppm, when applied with 100% NPK + Zn. In a balanced proportion or at the recommended amount, Goyal (2002) found that adding zinc to NPK increased the efficiency of both substances, which led to a continued synergistic interaction. Feiziasl and Valizadeh (2005) and Dwivedi et al. (2007) both revealed findings that are consistent with the current research (2007). We achieved the greatest DTPA-Fe levels using the based on sOil test fOr higher productivity and tO maintain sOil health. REFERENCES Behera, S. K. and Singh, D. 2010. Effect of 31 years of continuous cropping and fertilizer use on soil properties and uptake of micronutrients by Maize (Zea mays)-Wheat (Triticum aestivum) system. Indian Journal of Agricultural Sciences. 79: 264-267. Das, A., Patel, D. P., Munda, G. C. and Ghosh, P. K. 2010. Effect of organic and inorganic sources of nutrients on yield, nutrient uptake and soil fertility of maize Zea mays) - mustard Brassica campestris) cropping system. Indian Journal of Agricultural Sciences. 80: 85-88. Dwivedi, A. K., Muneshwar Singh, Kauraw, D. L., Wanjari, R. H. and Chauhan, S. S. 2007. Research bulletin on impact of fertilizer and manure use for three decades on crop productivity and sustainability and soil quality under Soyabean-Wheat system on a vertisol in Central India. Indian Institute of Soil Science (ICAR), Nabibagh, Bhopal. pp. 1-51. Feiziasl, V. and Valizadeh, G. R. 2005. Study on the effect of 5
Gill, R. 2003. Site specific nutrient management for maximizing crop yield of wheat. M.Sc. Thesis, Rajasthan Collage of Agriculturae, Maharana Pratap University of Agriculture and Technology, Udaipur. Goyal, J. P. 2002. Integrated nutrient management in maize-wheat cropping sequence. Ph.D. Thesis, Department of Agricultural Chemistry and Soil Science, Maharana Pratap University of Agriculture Technology, Udaipur. Graham , R. F., Wortman, S. E. and Pittelkow, C. M. 2017. Comparison of Organic and Integrated Nutrient Management Strategies for Reducing Soil N2O Emissions. Sustainability. 9: 510. doi:10.3390/ su9040510 Jackson, M.L. 1973. Soil: chemical analysis. Prentice Hall Inc. Engle Cliffs, New Jersey. Jaipaul, Sandal, S. K. Suri, V. K. and Dhiman, A. K. 2008. Validation of fertilizer adjustment equations based on yield target concept and complimentary use of organic and bio fertilizers along with inorganic fertilizers in rainfed maize (Zea mays) - wheat (Triticum aestivum) system in wet temperate zone of Himachal Pradesh. Indian Journal of Agricultural Sciences. 78: 490-494. Jat, M. L., Satyanarayana, T., Majumdar, K., Tetarwal, J. P., Jat, R. K. and Sharawat, Y. S. 2013. Fertilizer best management practices for maize systems. Indian Journal of Fertilizer. 9: 80-94. Khan, H., Hassan, Z. and Maitlo, A. A. 2006. Yield and micronutrients content of bread wheat (Triticum aestivum L.) under a multinutrient fertilizer-Hal-tonic. International Journal of Agriculture and Biology. 8(3): 366-370. Kumar, A., and Dhar, S. 2010. Evaluation of organic and inorganic sources of nutrients in maize (Zea mays) and their residual effect on wheat (Triticum aestivum) under different fertility levels. Indian Journal of Agricultural Sciences. 80: 364-371. Kumar, A., Meena, R. N., Lalji Yadav and Gilotia, Y. K. 2014. Effect of organic and inorganic sources of nutrient on yield, yield attribute and nutrient uptake of rice cv. PRH-10. The Bioscan. 9(2): 595-597. Kumar, R., Karmakar, S., Kumari, Sweety, Sarkar, A. K., Dutta, S. K. and Majumdar, K. 2013. Improving Productivity and Profitability of the Maize-Wheat System in Jharkhand. Better Crops. 97(4): 29-31. Lindsay, W. L. and Norvell, W. A. 1978. Development of a DTPA soil test for zinc, iron, manganese and copper. Soil Science Society of America Journal. 42: 421-428. Meena, S. R., Sharma, S. K., Sharma, M. and Ratnoo, R. S. 2017. Effect of long term application of fertilizer and manure on physico- chemical properties of soil under maize-wheat sequence in Heplustepts. Journal of Pharmacognosy and Phytochemistry. 6(3): 698-701. Nath, C. P., Das, T. K., Bhattacharyya, R., Pathak, H., Paul, S., Chakraborty, D., Hazra, K. K., 2017. Nitrogen effects on productivity and soil properties in conventional and zero tilled wheat with different residue management. Proceedings of the National Academy of Sciences, India - Section B: Biological Sciences. 89(C). at University of Agricultural Sciences Bengaluru India., Dec 2-4, 2010. pp. 37. Parkinson, R., 2013. System based integrated nutrient management. Soil Use Management. 29: 608. Rao, Subba and Sammi Reddy, K. 2005. Integrated nutrient management vis-à-vis crop production/ productivity, nutrient balance. Indian Journal of Fertilizers. 1: 77-83. Richards, L. A. 1954. Diagnosis of improvement of saline and alkali soils. U.S.D.A. Hand Book, No. 60. Roshani, G. A., Narayanaswamy, G. and Datta, S. C. 2005. Effect of potassium on root length density of wheat at different stages of growth. Journal of the Indian Society of Soil Science. 53(2): 217-221. Sharma G. D., Thakur, R., Raj, S., Kauraw D. L. and Kulhare, P. S. 2013. Impact of integrated nutrient management on yield, nutrient uptake, protein content of wheat (Triticum astivam) and soil fertility in a typic haplustert. The Bioscan. 8(4): 1159-1164. Singh, K. P. and Sarkar, M. C. 1985. Effect of method of phosphorus application on wheat yield, P uptake and indices of P availability. Journal of Indian Society of Soil Science. 33(4): 695-697. Singh, M. V. 2009. Effect of trace element deficiencies in soil on human and animal health. Bulletin of the Indian Society of Soil Science. 27: 75-101. Singh, S., Bhat, Z. A. and Rehman, H. U. 2014. Influences of organic and integrated nutrient management on physico-chemical properties of soil under basmati-wheat cropping sequence. The Bioscan. 9(4): 1471-1478. Singh, S. P., Vivek and Kumar, R. 2013. Effect of integrated nutrient management practices on soil health and economics of wheat (Triticum aestivum L.). Advances in Plant Sciences. 26(1): 125-128. Snell, F. D., Snell, C. T. 1959. Colorimetric method of analysis. 3rd Edition Volume IID. Van Nostrand Co. Inc. Priencenton, New Jersey. pp. 814-819. Subbiah, B. V. and Asija, G. L. 1956. A rapid procedure for the estimation of available nitrogen in soils. Current Science. 25: 254- 260. Swarup,A.2000.Long-term fertilizer experiments to study changes in soil quality, crop productivity and sustainability. Indian Institute of Soil Sciences, Bhopal. Tamilselvi, S. M., Chinnadurai, C., Iiamurugu, K., Arulmozhiselvan, K., Balachandar, D., 2017. Effect of long-term nutrient management on biological and biochemical properties of semi-arid tropical alfisol during maize crop developmental stages. Ecological Indicators. 48: 76- 87. Thakur, R., Sawarkar, S. D., Vaishya, U. K. and Singh, M. 2011. Impact of continuous use of inorganic fertilizers and organic manure on soil properties and productivity under soybean-wheat intensive cropping of a Vertisol. Journal of the Indian Society of Soil Science. 59: 74-81. Totawat, K. L., Somani, L. L., Singh, R. and Singh, G. 2001. Integrated nitrogen management in maize-wheat cropping sequence on typic Haplustalfs of western India. Annals of Arid Zone. 40: 439-444. Verma, A., Nepalia, V. and Kanthaliya, P. C. 2005. Effect of continuous cropping and fertilization on crop yields and nutrient status of a Typic Haplustept. Journal of the Indian Society of Soil Science, 53: 365- 368. Zhang, F., Chen, X., Vitousek, P. 2013. An experiment for the world. Nature. 497: 33-35. Olsen, S. R, Cole, C. V., Watanabe, F. S. and Dean, L. A. 1954. Estimation of available phosphorus in soil by extraction with sodium bicarbonate. Circ. V.S. Dep. Agric. p. 939. Panse, V. G. and Sukhatme, P. V. 1989. Statistical method for agriculture workers, ICAR, New Delhi. Paradkar, V. K., Tiwari, D. K. and Reddy, R. K. 2010. Response of baby corn to integrated nutrient management in: Extend Summaries, XIX National symposium on Resource Management Approaches Towards Livelihood Security, organized by Indian Society of Agronomy 6