Download
1 / 59
600 likes | 758 Views
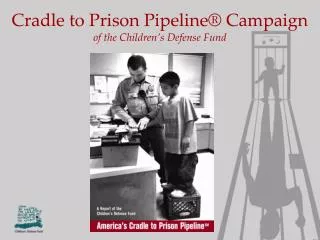
Cradle to Prison Pipeline® Campaign of the Children’s Defense Fund. What Fuels the Pipeline?. Pervasive Poverty Institutionalized racism Inadequate Access to Health Care Gaps In Early Childhood Development Programs Disparate Educational Opportunities Intolerable Abuse and Neglect

E N D
Cradle to Prison Pipeline® Campaign of the Children’s Defense Fund
What Fuels the Pipeline? • Pervasive Poverty • Institutionalized racism • Inadequate Access to Health Care • Gaps In Early Childhood Development Programs • Disparate Educational Opportunities • Intolerable Abuse and Neglect • Unmet Mental Health Needs • Rampant Substance Abuse • Overburdened and Ineffective Juvenile Justice Systems
The most dangerous place for a child to grow up in America is at the intersection of race and poverty.
Pervasive Poverty • A baby is born into poverty in America every 35 seconds. • Approximately 13 million children (1 in 6) live in poverty. • About 5.5 million of those children live in extreme poverty. • The majority of poor children live in working families. Source: U.S. Current Population Survey, Annual Social and Economic Supplement, March 2007. Calculations by the Children’s Defense Fund.
Child Poverty in New York State • New York has the 15th highest child poverty rate in the nation. Source: U.S. Department of Commerce, Bureau of the Census, American Community Survey 2006. Calculations by the Children’s Defense Fund-New York.
Pervasive Poverty Obtaining a high-school diploma is among the most important strategies to prevent poverty in adulthood.
Child Poverty in America: Quiz 1. True or False? In America, more White children are poor than children from any other racial or ethnic group.
Answer: TRUE In number, the 4.2 million White children who are poor exceed the 3.8 million Black and the 4.1 million Latino children who are poor. However, Black and Latino children are more likely to be poor than White children: • 1 in 3 Black children is poor, • 1 in 4 Latino children is poor, • 1 in 10 White children is poor. Source: U.S. Current Population Survey, Annual Social and Economic Supplement, March 2007. Calculations by Children’s Defense Fund.
2.True or False? Most of the increase in child poverty since 2000 has been among children who are just below the poverty line.
Answer: FALSE Since 2000, child poverty has increased by 1.2 million children but most of the increase –about 900,000 children- was among children living in extreme poverty, or with family income below half the federal poverty level (FPL). Source: U.S. Current Population Survey, Annual Social and Economic Supplement, March 2007. Calculations by Children’s Defense Fund.
3. True or False? The FPL is based each year on an analysis of the minimum amount a family needs for their basic necessities.
Answer: FALSE The FPL– in 2008 representing $21,200 for a family of four with two children-- is rarely enough to meet all basic necessities such as housing, food, child care, education, and health care. Source: Federal Register / Vol. 73, No. 15 /2008 for a four person family - Poverty Guidelines for the 48 Contiguous States and the District of Columbia.
Source: Economic Policy Institute, Basic Family Budget calculator, 2005. 2008 Federal Poverty Guidelines.
Basic Family Budget2004 Monthly costs for a family with 2 parents and 2 children in New York, NY needed for a safe yet modest standard of living: Housing $ 1,075 Food $ 587 Child care $ 1,195 Transportation $ 321 Health care $ 514 Other necessities $ 449 Taxes $ 747 Monthly Total $ 4,888 Annual Total $58,656 35% of people in New York, NY (1,106,000 people) had incomes below the annual level required for that city in 2004. Source: Economic Policy Institute, Basic Family Budget calculator, 2005. 2008 Federal Poverty Guidelines.
4. True or False? With the institution of the new minimum wage, a single parent with 2 children working full-time at the minimum wage will have an income in 2008 about the federal poverty level.
Answer: FALSE A full-time, minimum-wage worker in 2008 will earn about $13,000, whereas the FPL for a family of 3 this year is $17,600. Source: Federal Register / Vol. 73, No.15 /2008 for a three person family - Poverty Guidelines for the 48 Contiguous States and the District of Columbia. Calculations by the Children’s Defense Fund.
Inadequate Access to Health Care “If your family has money, you get psychiatric intervention…if your family has no money, you get the prison psychologist.” Ed Latessa University of Cincinnatti Criminologist Source: United Nations Children’s Fund (UNICEF), The State of the World’s Children 2008 (December 2007), Tables 1 and 2. Calculations by Children’s Defense Fund.
Inadequate Access to Health Coverage Devante Johnson 1993-2007
Inadequate Access to Health Coverage • There are 9.4 millionuninsured children in America. An estimated 384,000 children are uninsured in New York. • In New York, Black, Asian and Latino children are twice as likely as white children to be uninsured. Sources: U.S. Department of Commerce, Bureau of the Census, Current Population Survey, Annual Social and Economic Supplement, 2007. Calculations by the Children’s Defense Fund. United Hospital Fund, “Health Coverage in Ne w York, 2003-2004,” Urban Insitute and and the United Hospital Fund, November 2006.
Inadequate Access to Health Care • The U.S. ranks 25th among industrialized nations in infant mortality rate and 22nd in the percentage of babies born at low birthweight. Source: United Nations Children’s Fund (UNICEF), The State of the World’s Children 2008 (December 2007), Tables 1 and 2. Calculations by Children’s Defense Fund.
Inadequate Access to Health Care • One in 12 babies born in the U.S. is born at low birthweight, a rate that has been growing steadily since 1984. • Black babies are about twice as likely as Hispanic or White, non-Hispanic babies to be born at low birthweight. Source: U.S. Department of Health and Human Services, National Center for Health Statistics, National Vital Statistics Report, Vol. 56, No. 6, "Births: Final Data for 2005" (December 5, 2007), Table 33. Calculations by Children's Defense Fund
Inadequate Access to Health Care • A child born at low birthweight is about 50 percent more likely to score below average on measures of both reading and mathematics at age 17. • A child’s ability to succeed in the classroom depends on his or her healthy development. Source: Naomi Breslau, Nigel S. Paneth and Victoria C. Lucia, “The lingering academic deficits of low birthweight children,” Pediatrics, Vol. 114, No. 4 (October 2004), pp. 1035-1040.
Gaps in Early Childhood Development Programs Studies have shown that the quality of early childhood development programs has broad impacts on the well-being of children, including reduced rates of teen pregnancy, better health, lower drug use, reduced criminal activity, and increases in lifetime earnings. Only about 3 percent of eligible infants and young children (0-3) are enrolled in Early Head Start. Sources: W. Steven Barnett and Clive Belfield, "Early Childhood Development and Social Mobility," Future of Children 16, no. 2 (Fall 2006): 85; National Head Start Association; and National Women’s Law Center.
Gaps in Early Childhood Development Programs A U.S. Department of Education study of 22,000 kindergarteners (class of 1998-1999) found that Black and Hispanic children were substantially behind when they entered kindergarten. Source: U.S. Department of Education, National Center for Education Statistics, America’s Kindergarteners, Early Childhood Longitudinal Study—Kindergarten Class of 1998-99, NCES 2000-070 (Feb 2000), Tables 2, 3 and 4.
Disparate Educational Opportunities • Poor children tend to be in schools with limited resources. • New York City spends 17 times more to incarcerate a child in a juvenile detention center than to educate a child in a public school. Sources: 2008 New York City Mayor’s Management Report
Disparate Educational Opportunities • Black children are almost twice as likely as White children to repeat a grade. • In New York City, The 2001 suspension rate for City schools was 8.3 percent for black students and 4.8 percent for Latino students, compared to only 2.5 percent for white students. Sources: U.S. Department of Education, National Center for Education Statistics, Status and Trends in the Education of Blacks (September 2003), Supplemental Table 3.2; and Eskenazi, Michael, Gillian Eddins and John M. Beam. Equity of Exclusion: The Dynamics of Resources, Demographics, and Behavior in the New York City Public Schools. Fordham University: National Center for Schools and Communities. October 2003.
Disparate Educational Opportunities • In New York City, 49 percent of Black and 54 percent of Latino fourth graders cannot read at grade level. • Examples of fourth grade words include: Emergency Mayor President Ambulance Eyeglasses Volunteer Library Office Weight Length Inches Foot Public Museum Source: National Assessment of Education Progress, 2007 Trial Urban District Assessment
Disparate Educational Opportunities • In New York City, 55% of Black and 48% of Latino eighth graders cannot perform math at grade level. • An example of an eighth grade math problem is: 2x-7= 13 Sources: U.S. Department of Education, National Assessment of Education Progress, The Nation’s Report Card: Math 2007 (2007), Tables A-8 and A-9. Calculations by Children’s Defense Fund.
Disparate Educational Opportunities In 2006, only 54.6% of Black, 50.8% of Latino, and 76.9% of White students graduated from a New York City high school with a regular diploma. When Black children graduate from high school, they have a greater chance of being unemployed and a lower chance of going to college full-time than White high school graduates. Sources: U.S. Department of Commerce, Bureau of the Census, "School Enrollment -- Social and Economic Characteristics of Students: October 2005," Table 9, at http://www.census.gov/population/www/socdemo/school/cps2005.html .
Disparate Educational Opportunities Only 48,000 Black males earn a bachelor’s degree each year. But… An estimated 1 in 3 Black males ages 20-29 is under correctional supervision or control. Approximately 579,000 Black males are serving sentences in state or federal prison. Sources: U.S. Department of Education, National Center for Education Statistics; Digest of Education Statistics 2007 (March 2008), Table 274; U.S. Department of Justice, Bureau of Justice Statistics, Prison and Jail Inmates at Midyear 2006 (June 2007), Table 13; U.S. Department of Justice, Bureau of Justice Statistics, Probation and Parole in the United States, 2006 (December 2007), p. 2; and U.S. Department of Commerce, Bureau of the Census, "Annual Estimates of the Black or African American Alone or in Combination Population by Age and Sex for the United States: April 1, 2000 to July 1, 2006," at http://www.census.gov/popest/national/asrh/NC-EST2006-asrh.html . Calculations by Children's Defense Fund.
Zero Tolerance Policies Would you call the police if… All these events actually happened. • A 10-year old elementary school student took a pair of scissors out of her backpack during class? • A 6-year old child had a temper tantrum? • A 5-year old boy was misbehaving in school? • Two 4-year olds refused to take their nap? Sources: MSNBC. “10-year-old arrested over scissors.” Dec. 11, 2004; New York Times. “6-Year-Olds Under Arrest”. Apr. 9, 2007; NY Daily News. “5-year-old boy handcuffed in school.” Jan. 25, 2008; New York Post. “Public Enemy No.1” March 10, 2008.
Intolerable Abuse and Neglect A child is confirmed as abused or neglected every 36 seconds – almost 900,000 each year. Four in ten of the children who are abused or neglected get no help after the initial investigation. Sources: U.S. Department of Health and Human Services, Administration on Children, Youth and Families, Child Maltreatment 2005 (2007), Tables 3-3 and 3-6 and p. xv. Calculations by Children’s Defense Fund.
Nationalvs. NY State Data Children in foster care • 62.8% were neglected • • 16.6% were physically abused • • 9.3% were sexually abused • • 7.1% were psychologically or emotionally maltreated • • 2% were medically neglected • • 14.3% other types of maltreatment • 91.5% were neglected • 11.2% were physically abused • 3.9% were sexually abused • .7% were psychologically or emotionally maltreated • 9.4% were medically neglected • 24.8% other types of maltreatment Sources of Data: Child Maltreatment 2005, U.S. Department of Health and Human Services, Administration for Children, Youth and Families, July, 2005; and Child Maltreatment: Reports, Victims and Fatalities, National Center on Child Abuse Prevention Research, Prevent Child Abuse America, May 2006.
Intolerable Abuse and Neglect Black children are at particularly high risk of being in foster care. Although they comprise only 16 percent of all children, Black children represent 32 percent of the foster care population. Source: U.S. Department of Commerce, Bureau of the Census, Statistical Abstract of the United States: 2007 (2006), Table 14; and U.S. Department of Health and Human Services, Administration for Children and Families, AFCARS Report 13, Preliminary FY 2005 Estimates as of September 2006 (October 2006), at http://www.acf.hhs.gov/programs/cb/stats_research/afcars/tar/report13.pdf. Calculations by Children’s Defense Fund.
Unmet Mental Health Needs • A Congressional study found 15,000 children in juvenile detention facilities, some as young as 7 years old, solely because community mental health services were unavailable. • In 2007, 67% of youth incarcerated in NYC Department of Juvenile Justice detention centers have mental health disorders. Sources: U.S. Congress, House of Representatives, Committee on Government Reform, Minority Staff Special Investigations Division, Incarceration of Youth Who Are Waiting for Community Mental Health Services in the United States (July 2004), at http://oversight.house.gov/documents/20040817121901-25170.pdf ; and 2008 New York City Mayor’s Management Report
Rampant Substance Abuse The streets are open and available to our children 24 hours a day, 7 days a week. Alcohol and substance abuse treatment for youth and for parents are in too short supply. Source: U.S. Department of Health and Human Services, Substance Abuse and Mental Health Services Administration, National Survey on Drug Use and Health, 2006 results, at http://oas.samhsa.gov/NSDUH/2k6NSDUH/2k6results.cfm
Ineffective Juvenile Justice Systems • In New York State, black juveniles are about seven times as likely as their white peers to be incarcerated. • Nationally, Black juveniles are almost five times as likely and Latino juveniles about twice as likely as White juveniles to be incarcerated for drug offenses. Sources: New York State Division of Criminal Justice Services, and National Center for Juvenile Justice, Census of Juveniles in Residential Placement Databook, at http://www.ojjdp.ncjrs.org/ojstatbb/cjrp/. Calculations by the Children’s Defense Fund.
Moments in America for All Children • Every second a public school student is suspended. • Every 10 seconds a high school student drops out. • Every 17 seconds a public school student is corporally punished. Source: Calculations by the Children’s Defense Fund. 2008. Based on calculations per school day (180 days of seven hours each).
Moments in America for All Children • Every 9 minutes a child is arrested for a violent crime. • Every 18 minutes a baby dies before his or her first birthday. • Every 3 hours a child or teen is killed by a firearm. Source: Calculations by the Children’s Defense Fund. 2008.
Moments in America for All Children • Every 5 hours a child or teen commits suicide. • Every 6 hours a child is killed by abuse or neglect. • Every 14 hours a woman dies from complications of childbirth or pregnancy. Source: Calculations by the Children’s Defense Fund. 2008.