Download
1 / 20
200 likes | 430 Views
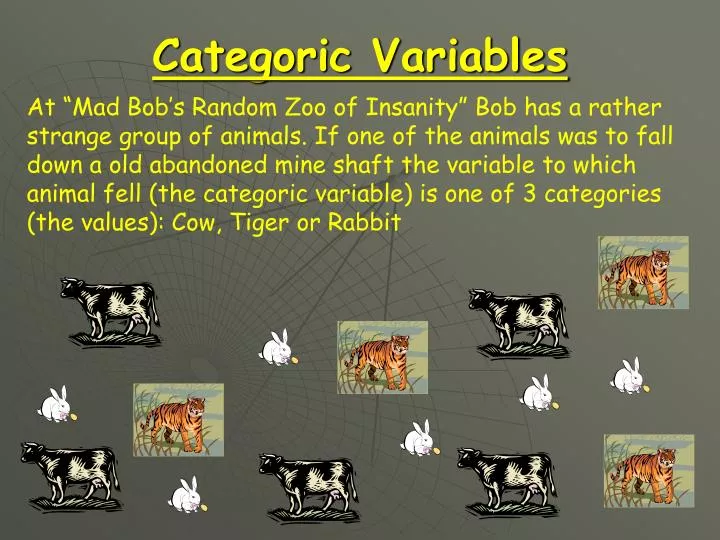
Categoric Variables. At “Mad Bob’s Random Zoo of Insanity” Bob has a rather strange group of animals. If one of the animals was to fall down a old abandoned mine shaft the variable to which animal fell (the categoric variable) is one of 3 categories (the values): Cow, Tiger or Rabbit.

E N D
Categoric Variables At “Mad Bob’s Random Zoo of Insanity” Bob has a rather strange group of animals. If one of the animals was to fall down a old abandoned mine shaft the variable to which animal fell (the categoric variable) is one of 3 categories (the values): Cow, Tiger or Rabbit
Categoric Variables Wendy collects balls, She has lots of them What is a categoric variable for the balls? Colour, with Values of Green Ball, Red Ball, Blue Ball & White Ball
Some of you may have said “Size” as a categoric variable for the balls, this is a type of categoric variable: Ordered Variable
Ordered Variable This is a type of categoric variable where the values can be ordered or ranked. The ordered variable for the balls could be size, where the values would be large, medium and small
Discrete Variables These are variables where the values can only be whole numbers. For example a discrete variable for the school could be the number of boys in a class. This must be a whole number (an integer) You cant have half a boy Without legal issues
Continuous Variables This is a variable which constantly varies over time and data should be taken either at a particular moment or over a period of time For example how the temperature of a room changes over a day
Independent Variables This is what you decide you are going to change in an investigation to see what effect it has. For example if you are investigating how the mass of a toy car effects its speed down a ramp the independent variable is the cars mass
Dependant Variables This is a variable which changes as you change the independent variable. It is the variable that you measure. For example if we are investigating how the steepness of a slope effects a toy car’s speed, then the speed is the dependant variable
Control Variables This is something which may effect your results but isnt what you are changing in the investigation (it isnt the independent variable) Control variables should be kept constant to ensure a fair test For example if you were seeing how the height dropped from effects an egg hitting the floor your control variables could be the type of egg and the floor surface
Natalie is comparing an ‘off the shelf’ antibacterial face-wash with a antibacterial hand wash that is used in hospitals. She placed three discs, each loaded with one drop of the agent, onto an agar plate that had been inoculated with bacteria. She repeated the investigation three times with each antibacterial agent. Her results are shown in the tables below. 1 What is the independent variable for this investigation? 2 Is the independent variable continuous, discrete or Categoric? 3 What is the dependent variable? 4 Is the dependent variable continuous, discrete or Categoric?
Joe investigated the power produced by solar cells with different areas. He used card to block out some of the cells on a solar buggy and then used a speed sensor to measure the speed that the buggy could reach. Joe's results are shown in Table B below. You will notice that he carried out each test three times. 1 Two of Joe’s results do not fit the pattern. Which results are they? 2 What was the independent variable in Joe's test? 3 Was the independent variable continuous, discrete or categoric? 4 What was the dependent variable? 5 Is the dependent variable continuous, discrete or categoric? 9 Write down one thing that Joe had to keep the same to make his test fair.
Random Error This is where your data is generally quite accurate apart from some results which are randomly spread around the true value Random Errors
Systematic Errors This is where a set of data has good precision (very little spread of results) around an incorrect mean value The table below shows a systematic error for measuring a 2m long table As you can see there is a systematic error of 5cm
Zero Error Last lesson you used a stick to measure a room or the playground. A problem with this is that the zero cm mark was probably not exactly on the end of the stick. This is called a zero error. The extra bit of stick will then be counted as part of the length making the results inaccurate. It can also be seen when meters like ammeters or voltmeters do not stop exactly on zero.
Accuracy & Precision Accuracy is when the dependant variable has repeated values which are close to the true value. Below is a table of accurate result for the mass of a rucksack whose true mass is 14.50kg. These results also show good precision as there is very little spread of results.
Calibration Back in ye olde days sailors used to use a rope tied to a log to measure boat speed. They would tie knots in the rope a set distance apart and time how many knots passed through there hands in a certain amount of time. Putting the knots in the rope at a set distance apart calibrated the rope to measure speed
Data & Datum Psycho Sarah likes kicking rabbits, she kicks one rabbit 2 metres This single measurement is called a datum She kicks a 2nd rabbit 1 metre These 2 measurements together are called data
Evidence Evidence is simply data which can be used to make a judgement as to what is happening
Fair Test This is a test where there is only one independent variable which effects the dependant variable
Validity & Reliability Valid measurements are measurements which give appropriate data. Reliable data is data whose validity has been evaluated