Download
1 / 47
530 likes | 952 Views
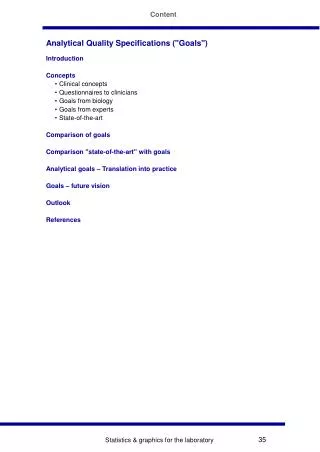
Content. Analytical Quality Specifications ("Goals"). Introduction Concepts Clinical concepts Questionnaires to clinicians Goals from biology Goals from experts State-of-the-art Comparison of goals Comparison "state-of-the-art" with goals Analytical goals – Translation into practice

E N D
Content Analytical Quality Specifications ("Goals") • Introduction • Concepts • Clinical concepts • Questionnaires to clinicians • Goals from biology • Goals from experts • State-of-the-art • Comparison of goals • Comparison "state-of-the-art" with goals • Analytical goals – Translation into practice • Goals – future vision • Outlook • References Statistics & graphics for the laboratory
Introduction Introduction • The analytical quality triangle • The establishment of analytical performance goals (quality specifications) is an important part of the analytical quality triangle, which should guarantee medically relevant quality of laboratory tests. • In the words of ISO 15196 – Analytical goals (discontinued) this is expressed as: "Well-defined analytical performance goals for clinical laboratories have practical, regulatory, and commercial implications. The goals help to determine the day-to-day practices of clinical laboratories. In turn, these goals should shape, if not drive the plans of IVD manufacturers to produce devices that can meet the analytical needs. In a proper synergy, regulatory agencies should base their expectations of laboratory quality on well-conceived analytical goals". • Unfortunately, the clinical community has not been able to establish a consensus on goals for analytical quality. A major problem is the involvement of many groups with different interests: "analytical performance goals shall be reviewed by the laboratory director to verify that they a. meet local medical needs; b. meet applicable regulatory requirements; c. are economically feasible; d. are technically achievable" (ISO 15196). • Nevertheless, what has been achieved is a consensus on a hierarchy of models to be used for the establishment of analytical goals. Statistics & graphics for the laboratory
Introduction Introduction • Hierarchy of models for the establishment of analytical goals • Clinical concepts • Concepts based on biological variation • Expert opinion • Regulations • "State-of-the-art" • Consensus Statement (Stockholm 1999).Scand J Clin Lab Invest 1999;59:585. • In the following, these concepts will be reviewed with the emphasis on their underlying statistical basis. For easier understanding, a list of abbreviations of biological and analytical components of variance is given below. • Abbreviations for biological variation • SDW-S/CVW-S (or CVw) = Within-subject • SDB-S/CVB-S (or CVb) = Between-subject • SDG/CVG (or CVg) = "Group" = SQRT(CV2W-S + CV2B-S) = ¼ of the reference interval • SDBiol/CVBiol : if the component (within, etc.) is not specified • CAVE: SDB-S often is understood asSDG • Abbreviations for analytical variation/error • SDA/CVA (or CVa) = Analytical • TEA = Total allowable analytical error Statistics & graphics for the laboratory
Clinical concepts Clinical concepts • Unifactorial health/disease models (1 analyte/1 disease) • For example: • HbA1c for long-term control of diabetes. • 2 Situations • Separate distributions (bimodal) of the analyte in sick and healthy • One distribution (unimodal) of the analyte in sick and healthy • Unimodal situation Bimodal situation • The bimodal situation • Prerequisites • The “gold-standard” • The true status of each population has to be established by other means than the test being subject to evaluation, namely, a so-called “gold standard”. • Defining a decision point (“cut-off” value) • A decision point (sick/healthy) must be defined. Note that this point must not lie at the crossing of the two distributions. Dependent on the importance of false negatives or false positives, it can be moved towards increased sensitivity or specificity. • Note: For monitoring, a medically significant change has to be defined. • Classification of results • With respect to the gold standard, test outcome is classified as “true positive”, “false positive”, “true negative”, or “false negative”. Statistics & graphics for the laboratory
Clinical concepts Clinical concepts – Bimodal situation (ctd.) • Analytical error and test outcome • At a given clinical situation, the influence of analytical quality on test sensitivity and specificity is investigated by simulation studies. • Simulation of systematic error • The introduction of a systematic error in the direction of the diseased population increases the false positive results. The introduction of a systematic error in the direction of the healthy population would increase the false negative results. • Simulation of random error • The introduction of random analytical error, generally, deteriorates test accuracy. • Simulation of systematic error Simulation of random error • Bias diseased > FP, FN General deterioration • Bias healthy > FP, FN of test accuracy • See also: Hyltoft Petersen P. Scand J Clin Lab Invest 1999;59:517-22 • Clinical concepts – Results • From considerations about maximum tolerable deterioration of the intrinsic clinical quality of a test, maximum values for analytical inaccuracy and imprecision are derived by simulation studies. • The derived specifications • are restricted to the specific clinical situation addressed • depend on the opinion of the clinicians involved (e.g., definition of the “cut-off” value) • depend on the parameter that was used for optimization (sensitivity, specificity, cost/benefit considerations, etc). Statistics & graphics for the laboratory
Clinical concepts Clinical concepts • Unimodal – Decision limits • Serum-Cholesterol • Uni-modal distribution • The whole population • Classification • Effect of analytical quality • Serum cholesterol in men – Effect of bias • Klee et al. Scand J Clin Lab Invest 1999;59:509-12 (wrong numbers: ±1, 3, 10%). • (200 mg/dl = 5.17 mmol/l; 240 mg/dl = 6.2 mmol/l) • On the basis of the hospital population at Mayo, the % misclassifications due to bias were investigated. • A bias of ±1% caused a -6.5% to +5.8% change in the classification of patients for cardiac disease. A bias of of ±3% caused a -18.4% to +16.7% change in the classification. From these data, a maximum bias of 1% was proposed for cholesterol. Statistics & graphics for the laboratory
Clinical concepts Clinical concepts • Unimodal – Decision limits • Serum cholesterol in men – Effect of bias • Similar investigations have been made by Hyltoft Petersen et al. (Clin Chim Acta 1997;260:189-206). However, they made a Gaussian model of the distribution and read the effect of bias from the cumulated distribution. Moreover, they mirrored the distribution and centered it at the decision point, for an easier visual assessment. • A bias of +3%, for example, incresed the positives from 48% to 62% (= +14%). However, no limit was recommended in that publication. • Effect of interferences • Assume a "low prevalence situation" where 0.2% of patients are found above a certain cutoff (= 2 of 1000). If the test shows 0.2% interferences that cause otherwise normal to be above the cutoff, 4 are tested positive (100% increase). For a prevalence of 2% (= 20 of 1000), 22 will test positive with a test with 0.2% interference (10% increase). • In a “high prevalence” situation, interference may be less a problem. Statistics & graphics for the laboratory
Clinical concepts Clinical concepts • Examples from literature • Haemoglobin A1c for long term diabetic control [1] • Theophylline in serum for therapeutic drug monitoring [2] • Creatine kinase isoenzyme in the diagnosis of acute myocardial infarction [3] • Blood thyroid-stimulating hormone in screening for congenital hypothyroidism [3] • Cholesterol as a measure for risk of coronary heart disease [3] • AFP, prenatal screening for neural tube defects [5] • Reviews: Hyltoft Petersen & Hørder [3, 4] and a special issue of the Upsala Journal of Medical Sciences [5]. • Summary clinical concepts • Their establishment is very complicated • They offer several values, dependent on the model used to derive them (e.g., optimisation of specificity, sensitivity, cost/benefit, etc.) • Only a few analytes have been tackled • They are extremely valuable Statistics & graphics for the laboratory
Clinical concepts Clinical concepts • References • 1 Larsen ML, Fraser CG, Petersen PH. A comparison of analytical goals for haemoglobin A1c assays derived using different strategies. Ann Clin Biochem 1991;28:272-8. • 2 Jenny RW. Analytical goals for determination of theophylline concentration in serum. Clin Chem 1991;37:154-8. • 3 Petersen PH, Hørder M. Ways of assessing quality goals for diagnostic tests in clinical situations. Arch Pathol Lab Med 1988;112:435-43. • 4 Hyltoft Petersen P, Hørder M. Influence of analytical quality on test results. Scand J Clin Lab Invest 1992;52 Suppl 208:65-87. • 5 de Verdier C-H, Groth T, Hyltoft Petersen P, editors. Medical need for quality specifications in clinical laboratories. Upsala J Med Sci 1993;98:189-491. • References specific to TSH • 1 Klee GG. Clinical interpretation of reference intervals and reference limits. A plea for assay harmonization. Clin Chem Lab Med 2004;42:752-7. • 2 Fatourechi V, Klee GG, Grebe SK, Bahn RS, Brennan MD, Hay ID, McIver B, Morris JC 3rd. Effects of reducing the upper limit of normal TSH values. JAMA 2003;290:3195-6. • 3 Fatourechi V, et al. Factors influencing clinical decisions to initiate thyroxine therapy for patients with mildly increased serum thyrotropin (5.1-10.0 mIU/L). Mayo Clin Proc 2003;78:554-60. • 4 Klee GG, Schryver PG, Kisabeth RM. Analytic bias specifications based on the analysis of effects on performance of medical guidelines. Scand J Clin Lab Invest 1999;59:509-12. • 5 Hay ID, Klee GG. Linking medical needs and performance goals: clinical and laboratory perspectives on thyroid disease. Clin Chem 1993;39:1519-24. • 6 Ward G, McKinnon L, Badrick T, Hickman PE. Heterophilic antibodies remain a problem for the immunoassay laboratory. Am J Clin Pathol 1997;108:417-21. • 7 Despre´s N, Grant AM. Antibody interference in thyroid assays: a potential for clinical misinformation. Clin Chem 1998;44:440–54. • 8 Ismail AAA et al. Wrong Biochemistry Results: Two Case Reports and Observational Study in 5310 Patients on Potentially Misleading Thyroid-stimulating Hormone and Gonadotropin Immunoassay Results. Clin Chem 2002;48:2023–29. Statistics & graphics for the laboratory
Clinical concepts Questionnaires to clinicians • Method • The clinicians or patients (self-monitoring) are presented for case histories or situations in the form of paper vignettes. • The physician / patient is often asked about a critical difference (CD, or Dmed) necessary to initiate/change an action. • Case story/situation • -Relevant problem • -Frequently encountered • -Laboratory test of especially importance • -Setting ”easily” described • -Conversational writing style; ”quoting” patients. • Example • Dependent on the question, the CD can comprise • Pre-analytical variation • Imprecision under defined conditions • Within-subject variation (CVW-S) • Group biological variation (CVG) • Bias Statistics & graphics for the laboratory
Questionnaires to clinicians Probability considerations ("z") • Probability/certainty that patients (physicians) attribute to the answer of the question depends on: • -Semantic of the question and - of course - the clinical situation • -Willingnes to accept false positive/negative actions • -”One sided” or ”two sided” situations • Establishment – Summary • Production of adequate questionnaires • Extraction of a medical action limit: Dmed • Transformation of Dmed into an analytical specification for CV, bias or TE • Calculations • Monitoring: Dmed = Bias+z•2•SQRT[CVA2+CVW-S2] • CVA = SQRT[{(Dmed-Bias)/z•2}2-CVW-S2] • Diagnosis: Dmed = Bias+1.65•SQRT[CVA2+CVG2] • CVA = SQRT[{(Dmed-Bias)/1.65}2-CVG2] • Note: z = 1.65 (1.96) for "better/worse" ("change") • Calculation example • Imagine that you have measured your blood glucose level to be 8.0 mmol/l • A. To what value do you think your blood glucose must increase to before you would be sure that it represents a true increase? ___ • B. To what value do you think your blood glucose must decrease to before you would be sure that it represents a true decrease? ___ • Answers Statistics & graphics for the laboratory
Questionnaires to clinicians Medical decision limits investigated • Medical decision limits (Dmed) related to biological variation (CVW-S) and analytical state-of-the-art (CVA) (the data of Linnet and Skendzel were used for the calculation) • When CVA = 0, is Dmed/CVW-S = 2.77 • When CVA/CVW-S = 0.5, is Dmed/CVW-S = 3.10 • When CVA/CVW-S = 1.5, is Dmed/CVW-S = 5.0 • We observe incongruent Dmed values: • Dmed/CVW-S should be ~3.5 for glucose • Dmed/CVW-S should be ~2.8 for triglycerides (biological variation underestimated?) • Summary – Goals from Questionnaires to Clinicians • Their establishment is complicated • Usually, they reflect the analytical quality the clinicians got offered • Sometimes they are based on incongruent Dmed values • Often, biological variation is not adequately considered, with the consequence that the derived values are mostly too generous • They are very useful when they were established in the correct manner Statistics & graphics for the laboratory
Questionnaires to clinicians References • Barnett RN. Medical significance of laboratory results. Am J Clin Pathol 1968;50:671-6. • Barrett AE, Cameron SJ, Fraser CG, Penberthy LA, Shand KL. A clinical view of analytical goals in clinical biochemistry. J Clin Pathol 1979;32:893–6. • Elion Gerritzen WE. Analytical precision in clinical chemistry and medical decisions. Am J Clin Pathol 1980;73:183-95. • Skendzel LP, Barnett RN, Platt R. Medical useful criteria for analyte performance of laboratory tests. Am J Clin Pathol 1985;83:200-5. • Thue G, Sandberg S, Fugelli P. Clinical assessment of haemoglobin values by general practitioners related to analytical and biological variation. Scand J Clin Lab Invest 1991;51:453-9. • See also • Gilbert RK. Progress and analytical goals in clinical chemistry. Am J Clin Pathol 1975;63:960-73. • Koch DD, Oryall JJ, Quam EF, et al. Selection of medically useful quality-control procedures for individual tests done in a multitest analytical system. Clin Chem 1990;36:230-3. Statistics & graphics for the laboratory
Goals for "multipurpose" analytes Goals for "multipurpose" analytes • Potassium test in a general laboratory • Urgency situations • Digitalis intoxication • Heart arrhytmias • Acute renal failure • Diarrhea • Therapy decisions, treatment with • Angiotensin-converting enzyme blocker • Digitalis • Diuretics • Monitoring illness • Diabetes mellitus • Chronic renal failure • Gastrointestinal diseases • Conclusions from the potassium example • It is NOT useful to set different goals for all the different situations. • Usually, 1 test is used for all applications in the laboratory. • Take the most stringent goal, then all situations are covered • The proposed goals are independent of the magnitude of potassium present in a specimen • Always gaussian distribution and 5% test-level is considered • Weakness of the approach • "One size NEVER fits all" • If there are better goals, use them • Proposal: Establish goals from biological variation Statistics & graphics for the laboratory
Goals from biology Goals from biology • General considerations for analytical goals • Monitoring: • Stable operation and low imprecision compared to the within-subject biological variation. • Diagnostic Testing: • Sufficient accuracy to allow the use of common reference intervals. • Goals from biology – The most important concepts • Tonks (1967) • Empirical concept • The total allowable analytical error (TEA) should not exceed one quarter of the reference interval (RI). • TEA 1/4[RI]/[mean of RI] x 100%. • Statistical background • Reference interval = 4 • CVG TEACVG • Cotlove, Harris & Williams (1970) • Relation of the analytical error (SDA) to a biological standard deviation (SDBiol) • SDA 0.5 SDBiol • Statistical background (in CV-terms) • CVA = 0.5 • CVBiol, • CVA adds only 12% to the • total test variability (CVT) • CVT = [(0.5 CVBiol)2 + CVBiol2]1/2 • CVT = 1.12 CVBiol • Relationship between concepts • Tonks & Cotlove, Harris & Williams are quite similar • If bias is neglected, TEA defined by Tonks equals 2 SDA • The reference interval represents the mean ± 2 SDG = 4 SDG • Tonks formula can then be written as: • 2 SDA 0.25 x 4 x SDG, equals SDA 0.5 SDG Statistics & graphics for the laboratory
Goals from biology Harris (1988) • Bias (B) and imprecision were both taken into account. • The original equation: • SDA 0.5 SDW-S (SDG) • Was thus changed into: • [SDA2 + B2]1/2 0.5 SDW-S (SDG). • Gowans et al. (1988) • Statistical background • Confidence interval (CI) of IFCC recommendations for establishment of a reference-interval: n = 120 • ... translated into increase of SDG by SDA Statistics & graphics for the laboratory
Goals from biology Gowans et al. (1988) • Statistical background > Imprecision • Confidence interval n = 120 translated into increase of SDG by SDA: • SDT = SQRT[SDG2 + SDA2]: =translated into imprecision • Statistical background > Bias • Confidence interval n = 120 translated into bias • Statistical background: IFCC reference-interval, n = 120 • Consequence: Confidence interval for sample size • n = 120, maximum 4.6% outside each limit • n = , maximum 2.5% outside each limit • Model • Allocate the difference n = 120 versus n = to analytical error • Outcome of the concept • B 0.25 SDG (without imprecision) • [SDA 0.6 SDG (without bias)] (original publication, meanwhile adapted) • SDA 0.52 SDG (without bias; from "diagnostic curve": see later!) Statistics & graphics for the laboratory
Goals from biology Klee (1993) • Statistical background: Influence of imprecision and bias of a test on its clinical specificity • Definition of an analytical "error budget": SQRT[SDA2+Bias2] • Limit: 50% increase in the false-positive rate for classifying healthy subjects (unimodal distribution, • ± 2s decision limit) • Outcome of the concept: • Error budget: 0.45 SDG • Allocated as • 0.36 SDG for bias, & • 0.18 SDG for SDA • Monitoring goals from biology • The reference change value (RCV) (Least "medical significant difference") (Harris & Yasaka Clin Chem 1983;29:25-30) • Calculations • Smallest medically significant difference (Dmed) that analytically can be detected for two consecutive measurements with P = 0.05 and SDA = 0: • Dmed = 1.96 x 2 x SDW-S = 2.77 x SDW-S • When D SE > 0 and SDA > 0, the equation can be rewritten (Larsen et al. 1991) • Dmed = 2.77 x (SDA2 + SDW-S2)1/2 + D SE Eq. 1 • When D SE = 0 and SDA= 0.5 SDW-S follows: • Dmed = 2.77 (0.25 SDW-S2 + SDW-S2)1/2 • Dmed = 3.10 SDW-S • When SDA = 0 and Dmed = 3.10 SDW-S, Equation 1 can be rearranged: • 2.77 x SDW-S + D SE = 3.10 SDW-S • Resulting in: • D SE 0.33 SDW-S • Summary • SDA 0.5 SDW-S • Dmed = 2.77 SDW-S if SDA = 0 • Dmed = 3.10 SDW-S if SDA = 0.5 SDW-S • D SE 0.33 SDW-S if SDA = 0 Statistics & graphics for the laboratory
Goals from biology When SE and RE are present (complex calculations!) • Reference change (Dmed) concept (left figure): • relationship between allowable drift and CVA in fractions of CVW-S (DSE/ CVW-S and CVA/CVW-S ).The figure shows the case Dmed = 3.10 CVW-S • Common reference interval concept (right figure): • relationship between allowable bias and CVA in fractions of CVG (SE/CVG and CVA/CVG). Case where 4.6% are outside each reference limit. • Goals – Monitoring & Diagnosis: Which is most stringent? • Monitoring and diagnosis use different biological CV • Assume CVb (between) = 1.75 • CVw (within) CVg~2 CVw • Transform the CVg scale in diagnosisto CVw • Monitoring gives more stringent goals Statistics & graphics for the laboratory
Goals from biology Missing data for SDW-S and SDB-S • Assumption • SDB-S = 1.75 • SDW-S, then SDG = SQRT(1.752 + 12) = 2• SDW-S • With • RI = 4 • SDG (RI: reference-interval) • Follows • RI = 4 • 2 • SDW-S = 8 • SDW-S > SDW-S = RI/8 • Assumption • SDA~ 0,5 • SDW-S • Follows • SDA~ 1/15 RI, • Conclusion for SDA • When data for SDW-S and SDB-S are missing, take RI/15 to comply with the Harris concept Statistics & graphics for the laboratory
Goals from biology Summary • Goals from biology – Summary • Conclusion: most values for CVA are ~0.5 CVBiol; most values for bias are ~0.25 or 0.33 CVBiol. Values for total error vary, another concept will be shown later (see Ricos concept). • Goals from biology – Most often used • For monitoring as: • SDA 0.5 SDW-S (in the absence of unidirectional systematic changes) • DSE 0.33 SDW-S (when imprecision is negligible) • For diagnostic testing as: • B 0.25 SDG (when the imprecision is negligible), or • SDA 0.52 SDG (when bias is negligible; from "diagnostic curve") Statistics & graphics for the laboratory
Goals from biology TE from biology • The Ricos et al.concept$ (TE = SE + z• RE) • $Ricós C, Baadenhuijsen H, Libeer J-C, Hyltoft Petersen P, Stöckl D, Thienpont LM, Fraser CG. Eur J Clin Chem Clin Biochem 1996;34:159-65. • TE = 0.25• CVg + 1.65 • [0.5• CVw] • CVg = group biological variation (can be calculated from CVw and CVb; alternatively = ¼ of the reference interval) • CVw = within-subject biological variation • CVb = between-subject biological variation • Note: in www.westgard.com CVg = CVb • Remark: The Ricos et al. concept is a simplified, practical concept and a hybrid between monitoring and diagnosis. • The Ricos et al. concept combines concepts for monitoring & diagnosis by use of the respective RE/SE goals with SE = 0 and RE = 0. • Remark • TEa is not constant in the biological concepts; it depends on the SE/RE-ratio: • Select a realistic SE/RE-ratio. Choose, in the monitoring case the point SE = RE TE = 0.66 CVw • TERicos = 0.25•CVg(=2•CVw) +1.65•[0.5•CVw] = 1.3 • CVw • The Ricos concept • gives too big TE-values. Statistics & graphics for the laboratory
Goals from biology TE from biology • BUT: Some are too stringent for current technology • Biology gives extreme low values for some analytes: • TEa sodium: Ricos: 0.9%(http://www.westgard.com/biodatabase1.htm; but note: CVg on that site = CVb) • Apply a bottom-line# • #Stöckl D. Desirable Performance criteria … based on biological analyte variation - hindrances to reaching some and reasons to surpass some. Clin Chem 1993;39:913-4. • Bottom-line (for stable process!) • CV: 1% • Bias: 1,5% • TE: 3,2% • Consider to surpass some • Think about using more stringent goals than derived from biology the goals are a compromise; account for IQC; some goals are surpassed, by far, by current technique. • Stöckl D. Desirable Performance criteria … based on biological analyte variation - hindrances to reaching some and reasons to surpass some. Clin Chem 1993;39:913-4. • Tonks: 10% upper limit for TE Statistics & graphics for the laboratory
Goals from biology TE from biology • NOTE • When data for CVw and CVb are not available, • "Ricos": • take 1/6th of the reference interval! (assumption CVb = 1.75 • CVw) • Monitoring ("Most stringent"): • take 1/10th of the reference interval! • Conclusions • Desirable analytical quality should be based on within- and between-subject biological variation because: • the model is simple to understand and apply • there are many data on biological variation • the within- and between-subject biological variations are nearly constant over geography • when these criteria are fulfilled, the analytical quality will satisfy most clinical needs • the model has a great practical and educative value. • But • Sometimes they are too narrow (e.g., electrolytes), sometimes they are too broad (e.g., enzymes). • They do not consider that different requirements might be necessary for different concentrations. • Current approaches give too generous values. Statistics & graphics for the laboratory
Goals from experts Goals from "Experts" • Statistical background • Usually, empiric • Establishment • EQA-performance • "State-of-the-art" performance Statistics & graphics for the laboratory
Comparison of goals State-of-the-art versus State-of-the-art • Comparison of imprecisiondata (“mean claims”)of the instrument • generation 2001from 4/5manufacturers. Statistics & graphics for the laboratory
Comparison of goals State-of-the-art versus State-of-the-art • There is a big difference between best and worst state-of-the-art • Note: “Best/worst” do not refer to the complete system. E2 may be best on 1 system, but the same system may have a poor fT4 test • For clinical chemistry, total CV’s of the best systems are generally <2%, with a minimum of 0.5% • For immunochemistry, total CV’s of the best systems are generally <5%, with a minimum of 2% Statistics & graphics for the laboratory
Comparison of goals Questionnaire & Biology • The table compares analytical goals from questionnaires [1], with analytical goals from biology [2]. It shows that goals from questionnaires may be very generous (for example, Calcium: CV = 4.8%; Cholesterol: CV = 12.3%). A weakness in that publication was that clinicians may have neglected the biological variation of the analytes (see also p. 46). • [1] Skendzel LP, Barnett RN, Platt R. Medical useful criteria for analyte performance of laboratory tests. Am J Clin Pathol 1985;83:200-5 (Questionnaire). • [2] Fraser CG, Hyltoft Petersen P, Ricos C, Haeckel R. Proposed quality specifications for the imprecision and inaccuracy of analytical systems for clinical chemistry. Eur J Clin Chem Clin Biochem 1992;30:311-7 (Biology). Statistics & graphics for the laboratory
Comparison of goals European EQA (% limits from 13 countries) – "Expert goals" • Analytes arranged by increasing biological variation. • From: Ricos et al. Eur J Clin Chem Clin Biochem 1996;34:159-65. • The table shows an extreme variation in EQA-goals. • Proposed goals – Is there a consensus? • TEa ofserum sodium measurement • TEa ofserum glucose measurement • Unfortunately, there is no consensus in goal-setting! Statistics & graphics for the laboratory
Comparison of goals Overview • Goals for analytical quality –Résumé • Most obvious for daily practice • The “own” state-of-the-art • Legislation/EQA • Most relevant for the patient • ”Clinical” • ”Biological” • Most realistic as goal • The “better” state-of-the-art • ”Monitoring”/”diagnosis” • Relevance beyond establishing analytical goals • Clinical concept • Important for test selection (“a-priori quality”) • Questionnaires to clinicians • Important for the use of a test in practice • Biology • Determines the treshold for action (Dmed monitoring) • Determines the “gray” zone in diagnosis Statistics & graphics for the laboratory
Comparison "state-of-the-art" with goals State-of-the-art/"Harris" (CVa 0.5 CVW-S) • Some remarks at the beginning • Currently insufficiently known: • Bias from comparison with a reference method • SE from calibration tolerance/IQC limits • The global effect of unspecificity/interference • Usually, SE goals cannot be investigated and TE goals, only, can be compared with 2 • CV Comparisons are restricted to RE TE goals from biology: "1 number for all" Comparisons are restricted to CV's in the reference interval Statistics & graphics for the laboratory
Comparison "state-of-the-art" with goals State-of-the-art/"Harris" (CVa 0.5 CVW-S) • Other way of presentation • We can look at the contribution of the analyticalvariance to the total variance. For CVa 0.5 CVW-S this translates to CVA2 20% of CVtot2; • CVtot2 = [CVA2 + CVW-S2] = [0.25 CVW-S2 + CVW-S2] = 1.25 CVW-S2. Statistics & graphics for the laboratory
Comparison "state-of-the-art" with goals Contribution of analytical variance to total • CVA2 in % of [CVA2 + CVW-S2]; Basis: Best CVA and CVW-S • CVA2 in % of [CVA2 + CVG2]; Basis: Best CVA and CVG • State-of-the-art/"Harris" (CVa 0.5 CVW-S) • 1st summary and remarks • Bias (SE), and consequently TE, cannot be assessed reliably The optimistic point-of-view For imprecision: thebeststate-of-the-art seems to be close to thecurrently usedbiological goals: Exceptions: Na, Cl, Ca & Mg BUT: GOALS are for the laboratory! Consequences for the manufacturer? What if bias, interferences, etc. are considered? Statistics & graphics for the laboratory
Analytical goals – Translation into practice Analytical goals – Translation into practice • GOALS are for the laboratory: TE = SE + 1.65 x RE! • Translation requirements for the manufacturer • Give room for the laboratory • Leave room for realistic IQC procedures • As manufacturer, • consume only a part of the goal! : 1/2 to 1/4? • What about goals expressed as total error? • How to fractionate (allocate) TE in SE/RE components? • To answer these questions, we will address • -Finding the "manufacturer line" • -TE-calculation with 1- and 2-sided random error • -Distributions at different SE/RE ratios (position of an "operating point") • -"Fractionation" of TE at various ratios of SE/RE • For this purpose, we will make use of the Westgard total error charts. • Construction of TE-charts (Example TE = 10%) • TE charts are constructed by use of the formula TE = SE + k x RE. The SE component is plotted on the y-axis, the RE component on the x-axis. • First, SE is calculated for RE = 0; SE = 10% • Second, RE is calculated with SE = 0; RE = 10%/k; for k = 2 RE = 5%. • Then, the 2 points are connected. All points on the line follow the respective equation 10% = SE + k x RE. • Laboratory line: k = 1.65! Statistics & graphics for the laboratory
The laboratory line The manufacturer line Analytical goals – Translation into practice Finding the "manufacturer line" • How big should “k” be? • Give room for IQC • We look into the Westgard TE-charts used for IQC: "OPSpecs-charts" • From IQC OPSpecs: “k” should (at least) be 4 • (Note: nearly all IQC-lines are at the left of k = 4) Statistics & graphics for the laboratory
Analytical goals – Translation into practice TE-lines: the 1-sided/2-sided problem • Populations at different operating points (TE = 10%) • Move operating point along the 1.65-line (1-sided 95% TE limit) • Populations with high SE: 1-sided, 5% out of +10% TE-limit • Populations with low SE: 2-sided, 10% out of ±10% TE-limit • The 1-sided case (high SE) changes gradually to the 2-sided case • The 2-sided case becomes relevant at SE RE • TE curves at fixed “out-of-limit-percentage”, principally, • should respect 1- & 2-sided probabilities. • At SE RE (SE/RE 1) the probabilities become practically 1-sided Statistics & graphics for the laboratory
Analytical goals – Translation into practice Distributions at different SE/RE ratios • Chart with the TE-lines: TE = SE + k • RE (k = 1.65/2/3/4) • Move along different SE/RE ratios and look at the populations at the intersection points of the SE/RE-lines with the TE-lines at different k-values. SE/RE = 1/16 Robust situation An excellent method (k = 4) allows additional SE SE/RE = 16 Labile situation An excellent method (k = 4) does not allow much more SE Statistics & graphics for the laboratory
Analytical goals – Translation into practice Observations from the Westgard TE-chart • Position of an operating point • Operating points at big SE/RE ratios describe “labile” analytical procedures -The difference between excellent and poor method (Westgard terminology) is marginal • Operating points at small SE/RE ratios describe “robust” analytical procedures. • Method decision chart • The distinction between excellent to poor methods is meaningless at high SE/RE ratios. • "Fractionation" of TE at various ratios of SE/RE • Calculation of TE along SE/RE = 16 & 1/16 at different k-values • TE = SE + 1.65 • RE (SE/RE = 16) • TE = SE + 2 • RE (SE/RE = 1/16) • Further observations from the Westgard TE-grid (TE = 10%) • Along: • The SE/RE = 16 line The SE/RE = 1/16 line • k TE k TE • 1.65 10 2 10 • 3 9.3 3 6.7 • 4 8.8 4 5.1 • Fractionation of TE occurs onlyat “medium to low” SE/RE ratios Statistics & graphics for the laboratory
Analytical goals – Translation into practice “Allocation and fractionation” of TE • TE goal 10% • Direction [0;0] to [SE=RE]; move from k = 1.65 to k = 4 • k = 1.65: SE = 3.8%; RE = 3.8% • at k = 4: SE = 2%; RE = 2% TE (k = 4) = 5.3% • Direction [0;0] to [SE=0;RE]; move from k = 2 to k = 4 • k = 2: SE = 0%; RE = 5% at k = 4: SE = 0%; RE = 2.5% TE (k = 4) = 5% • Movement in the Method Decision Chart at a SE/RE = 1 ratio from the 1.65s-line to the 4s-line • TE drops to 53% of original • Movement in the Method Decision Chart at SE = 0 from the 2s-line to the 4s-line TE drops to 50% of original • The fraction of the manufacturer • Start from the lab TE for monitoring (#) and use • TE = SE + 1.65 • RE • Move in the Method Decision Chart at a SE/RE = 1 ratio from the 1.65s-line to the 4s-line [for SE = 0 from the 2s-line to the 4s-line] TE manufacturer 50% of TE lab • Take as bottom-line (Stöckl, Clin Chem): • CV ~ 0.5%, SE ~ 1%, • TE ~ 1.8% (k = 1.65) • Laboratory bottom-line (TE~2 • manufacturer): • CV ~ 1%, SE ~ 1.5%, TE ~ 3.2% • (#) When the biological variation is unknown, use • TE = 1/10 RI ( TE monitoring at RE = SE). Statistics & graphics for the laboratory
Goals – future vision Laboratory goals from biology – future vision • Always consider SE & RE • Choose a TE-value • in relation to a certain SE/RE-ratio • Use “bottom-line” goals • RE = 1%, SE = 1.5%, TE = 3.2% • [Use maximum values] • RECALL • “Sometimes too small, sometimes too broad” • Be practical: • Tonks/Stöckl: Use upper-/lower limits • Tonks: 10% upper limit for TE • Stöckl: 1% (0.5%) lower limit for bias (imprecision) • Tonks DB. A study of accuracy and precision of clinical chemistry determinations in 170 canadian laboratories. Clin Chem 1963;9:217-33. • Stöckl D. Desirable Performance criteria for quantitative measurements in medical laboratories based on biological analyte variation - hindrances to reaching some and reasons to surpass some. Clin Chem 1993;39:913-4. • Current and future goals compared • Laboratory • Current: CVa 0.5 CVW-S ("Harris"; without bias) • Future: CVa 0.25 CVW-S ("Advanced laboratory goal"; with bias) • Manufacturer • Current: CVa 0.5 CVW-S ("Harris"; without bias) • Future: 50% of "Advanced laboratory goal" • CVa 0.125 CVW-S ("Advanced manufacturer goal") • Future = ¼ of current! Statistics & graphics for the laboratory
Goals – future vision CVA – Manufacturer "advanced"/"State-of-the-art" • Contribution of analytical uncertainty to total (compare with p. 67!) • UA2 in % of [UA2 + CVW-S2] • Laboratory UA(incl. Bias, etc) = 4 x best CVA and CVW-S • UA2 in % of [UA2 + CVG2] • Laboratory UA(incl. Bias, etc) = 4 x best CVA and CVG • 2nd summary and remarks • Assumption: bias, interferences, etc • Assumption: the uncertainty of the laboratory is 4 x the best manufacturer performance The pessimistic point-of-view There are very many problem analytes according to the biological concept, in particular, in the monitoring situation! Statistics & graphics for the laboratory
Outlook Analytical quality – still an issue? • We believe YES • Quality compared to goals • Stöckl D. Modern quality management misunderstood? Clin Chem 1998;44:1066-7. • Others believe NO • Quality compared to own process specifications • Quality evaluated against “harm” but not against usefulness • -Blumenthal D. The errors of our ways. Clin Chem 1997;43:1305. • -Plebani M, Carraro P. Mistakes in a stat laboratory. Clin Chem 1997;43:1348-51. • -Witte DL et al. Errors, mistakes, blunders, and outliers, or unacceptable results: how many? Clin Chem 1997;43:1352-6. • Analytical quality – The future? • Market transparency – independent of goals -Why should I pay the same for different quality (compare with reference methods) • Quality assessed against usefulness (“does not harm” is not sufficient anymore) -Evidence-based • New analytes • Reconsider old/develop new diagnostic strategies (#) • (#) Hammond HC. Applying the value-of-information paradigm to laboratory management. Clin Lab Manage Rev 1996;10:98-106. (measuring, or not, glucose for the early identification of diabetes) • Priority list for improvement • Imprecision -medium priority (between day) • Bias/traceability -high priority for some analytes (be careful during “restandardisation”) • [Diagnostic]accuracy on individual sample -highest priority (see hCG example, Lancet 2000;355:712) Statistics & graphics for the laboratory
Outlook Analytical quality – the future? • Remember, the influence on TE of: • Bias (traceability)/SE • Sample related effects (overall matrix) • Specificity (cross-reactions) • Common interferences (lipemia, etc.) • Effects of drugs • Auto-/heterophilic antibodies • Genetic variants • Insufficiently known • Important for the future:quality for the individual sample (patient!) • Remarks • Know the different concepts for deriving analytical quality specifications (= goals), but be able to use them in the appropriate manner • Make a difference between “desirable” and required quality • Take critically part in establishing (inter)national specifications • Stay informed about “state-of-the-art” quality • Analytical goals – Which ones to use? • Document your own quality • Compare it with the “state-of-the-art” • Identify therefrom “problem analytes” • Compare it with international goals • Identify therefrom “problem analytes” or “problem goals” • Identify “problem analytes” by communication with the laboratories/clinicians • Identify “possible” problem analytes by comparison with “biological“ specifications: biological variation, ref.-intervals • Verify “possible” problem analytes by comparison with “clinical“ specifications and “bottom-line” goals • Check whether you want to improve the quality of some tests, independent of proposed goals Statistics & graphics for the laboratory
References Data on biological variation • Ross JW. Evaluation of precision. In: Werner M, ed. CRC Handbook of Clinical Chemistry. Boca Raton, Fla: CRC Press: 1982;1:391-422. • Fraser CG. The application of theoretical goals based on biological variation data in proficiency testing. Arch Pathol Lab Med 1988;112:404-15. • Fraser CG. Biological variation in clinical chemistry. An update: collated data, 1988-1991. Arch Pathol Lab Med 1992;116:916-23. • Fraser CG. Databases for facilitating work on setting quality specifications: biological variation. Upsala J Med Sci 1993:98:415-6. • Sebastian-Gambaro MA, Liron-Hernandez FJ, Fuentes-Arderiu X. Intra- and inter-individual biological variability data bank. Eur J Clin Chem Clin Biochem 1997;35:845-52. • Selected references • Analytical goals • Stöckl D, Baadenhuijsen H, Fraser CG, Libeer J-C, Hyltoft Petersen P, Ricós C. Desirable routine analytical goals for quantities assayed in serum (Discussion paper from the members of the EQA Working Group A on analytical goals in laboratory medicine). Eur J Clin Chem Clin Biochem 1995;33:157-69. • Fraser CG, Hyltoft Petersen P, Ricos C, Haeckel R. Proposed quality specifications for the imprecision and inaccuracy of analytical systems for clinical chemistry. Eur J Clin Chem Clin Biochem 1992;30:311-7. • Fraser CG, Hyltoft Petersen P, Ricos C, Haeckel R. Quality specifications. In: Haeckel R, editor. Evaluation methods in laboratory medicine. Weinheim: VCH Verlagsgesellschaft, 1993:87-99. • Ross JW. Evaluation of precision. In: Werner M, ed. CRC Handbook of Clinical Chemistry. Boca Raton, Fla: CRC Press: 1982;1:391-422. • Fraser CG. The application of theoretical goals based on biological variation data in proficiency testing. Arch Pathol Lab Med 1988;112:404-15. • Fraser CG. Biological variation in clinical chemistry. An update: collated data, 1988-1991. Arch Pathol Lab Med 1992;116:916-23. • Fraser CG. Databases for facilitating work on setting quality specifi-cations: biological variation. Upsala J Med Sci 1993:98:415-6. • Sebastian-Gambaro MA, Liron-Hernandez FJ, Fuentes-Arderiu X. Intra- and inter-individual biological variability data bank. Eur J Clin Chem Clin Biochem 1997;35:845-52. • Tonks DB. A study of accuracy and precision of clinical chemistry determinations in 170 canadian laboratories. Clin Chem 1963;9:217-33. • Cotlove E, Harris EK, Williams GZ. Components of variation in long term studies of serum constituents in normal subjects. III. Physiological and medical implications. Clin Chem 1970;16:1028-32. • Harris EK. Statistical principles underlying analytical goal-setting in clinical chemistry. Am J Clin Pathol 1979;72:374-82. • Elevitch FR, editor: Analytical goals in clinical chemistry. Proceedings of the CAP Aspen Conference; 1976; Skokie (IL). Skokie (IL): College of American Pathologists, 1977. • Proceedings of the subcommittee on analytical goals in clinical chemistry, World Association of Societies of Pathology, London, Analytical goals in clinical chemistry: Their relationship to medical care. Am J Clin Pathol 1979;71:624-30. • Harris EK. Proposed goals for analytical precision and accuracy in single point testing. Arch Path Lab Med 1988;112:416-20. Statistics & graphics for the laboratory
References Selected references • Ross JW. A theoretical basis for clinically relevant proficiency testing evaluation limits: Sensitivity analysis of the effect of inherent test variability on acceptable method error. Arch Path Lab Med 1988;112:421-34. • Ross JW, Fraser MD. Analytical goals developed from inherent error of medical tests. Clin Chem 1993;39:1481-94. • Gowans EMS, Hyltoft Petersen P, Blaabjerg O, Horder M. Analytical goals for the acceptance of common reference intervals for laboratories throughout a geographical area. Scand J Clin Lab Invest 1988;48:757-64. • Klee GG. Tolerance limits for short-term analytical bias and analytical imprecision derived from clinical assay specificity. Clin Chem 1993;39:1514-8. • Harris EK, Yasaka T. On the calculation of a "reference change" for comparing two consecutive measurements. Clin Chem 1983;29:25-30. • Hyltoft Petersen P, Fraser CG, Westgard JO, Lytken Larsen M. Analytical goal-setting for monitoring patients when two analytical methods are used. Clin Chem 1992;38:2256-60. • Queralto JM, Boyd JC, Harris EK. On the calculation of reference change values, with examples from a long-term study. Clin Chem 1993;39:1398-1403. • Goals from "experts" • Richtlinien der Bundesärztekammer zur Qualitätssicherung in medizinischen Laboratorien. Dtsch Ärztebl 1988;85:A699-A712. • Department of Health and Human Services. Medicare, Medicaid and CLIA programs; regulations implementing the Clinical Laboratory Improvement Amendments of 1988 (CLIA). Fed Regist, Feb 28, 1992;57:7002-186. • Belgisch Staatsblad - Moniteur Belge. 01.04.1996. N. 96-716. • Ricós C, Baadenhuijsen H, Libeer J-C, Hyltoft Petersen P, Stöckl D, Thienpont LM, Fraser CG. External quality assessment: currently used criteria for evaluating performance in European countries, and criteria for future harmonization. Eur J Clin Chem Clin Biochem 1996;34:159-65. • Reference intervals • Harris EK, Boyd JC. Statistical bases of reference values in laboratory medicine. Washington: AACC Press, 1995:384pp. • Burtis CA, Ashwood ER, eds. Tietz Textbook of Clinical Chemistry. 2nd ed. Philadelphia (PA): W.B. Saunders Co, 1994. • Heil W, Schuckließ F, Zawta B. Reference ranges for adults and children. Klinikum Wuppertal-Barmen, Universität Witten-Herdecke und Boehringer Mannheim GmbH: 1995. • Soldin SJ, Hicks JM, Gunter KC, Brugnara C (editors). Pediatric reference ranges. 2nd edition. Washington: AACC Press, 1997:181pp. • Perkins SL, Livesey JF, Belcher J. Reference Intervals for 21 clinical chemistry analytes in arterial and venous umbilical cord blood. Clin Chem 1993;39:1041-4. • Tietz NW, Shuey DF, Wekstein DR. Laboratory values in fit aging individuals - sexagenerians through centenarians (special report). Clin Chem 1992;38:1167-85. • Caroli S, Alimonti A, Coni E, Petrucci F, Senofonte O, Violante N. The assessment of reference values for elements in human biological tissues and fluids: a systematic review. Crit Rev Anal Chem 1994;24:363-98. Statistics & graphics for the laboratory
Notes Notes Statistics & graphics for the laboratory
Notes Notes Statistics & graphics for the laboratory