Download
1 / 35
350 likes | 895 Views
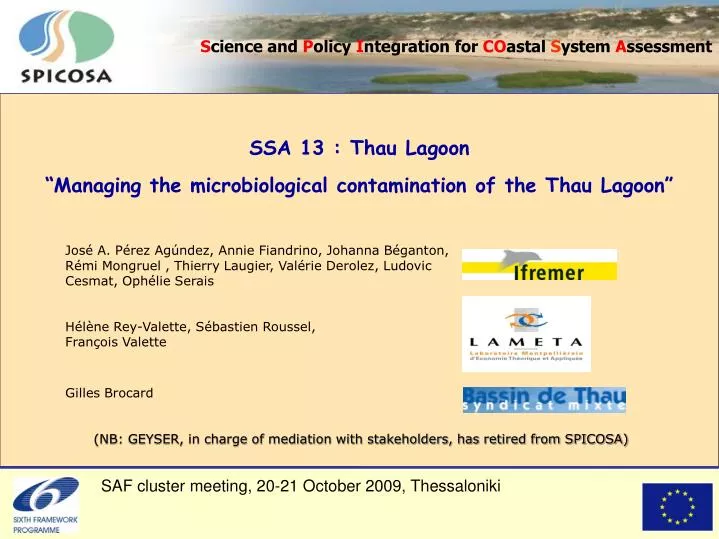
SSA 13 : Thau Lagoon “Managing the microbiological contamination of the Thau Lagoon”. S cience and P olicy I ntegration for CO astal S ystem A ssessment.

E N D
SSA 13 : Thau Lagoon “Managing the microbiological contamination of the Thau Lagoon” Science and Policy Integration for COastal System Assessment José A. Pérez Agúndez, Annie Fiandrino, Johanna Béganton, Rémi Mongruel , Thierry Laugier, Valérie Derolez, Ludovic Cesmat, Ophélie Serais Hélène Rey-Valette, Sébastien Roussel,François Valette Gilles Brocard (NB: GEYSER, in charge of mediation with stakeholders, has retired from SPICOSA) SAF cluster meeting, 20-21 October 2009, Thessaloniki
Content • Introduction : policy issue, scenarios, socio-economic dimensions and structure of the system to be modelled • Building the model with Extend (modular use, connections) • Watersheds and the Water treatment system • Microbiological contamination: monitoring and law enforcement • Economic assessment • Conclusion : state of work ; interactions with stakeholders
An overview of the policy issue • The general problem : because of rapid local demographic growth and also the importance of tourism, the watersheds of the Thau lagoon are subject to pollution. In particular, events of microbiological contamination may affect the lagoon, with direct consequences on human activities in the Lagoon and also feedbacks to the overall development pattern of the region. • The microbiological contamination raises four basic questions:1) What are the impacts of microbiological contamination on shellfish farming and other human activities in the lagoon ? • 2) What are the main contamination sources ? 3) What is the efficiency of the current water treatment system as regards microbiological contamination ? 4) Which management options would reduce the impacts of MC in a way which would be coherent with the more global local policy objectives ? • Another research project, OMEGATHAU (to be completed by the end of 2010), which has been conducted jointly with the local public organisation in charge of Thau Lagoon water management (SMBT), has addressed the 2 first questions. Our approach for the SPICOSA SSA work in the Thau Lagoon is to rely on OMEGATHAU results in order to explore questions 3 and 4.
Policy context : two corresponding management plans SAGE The local water management plan,which defines the water policyfor the Lagoon and its watersheds Coherence of - perimeters- diagnosis- objectives A shared diagnosis SCOT The territorialmanagement plan,whose perimeter iscoherent with theone defined forthe water policy
The current policy debate and theexpectations from the SPICOSA experiment • The local policy framework, which has been set up during the preparation of the Territorial Management Plan (SCoT) gives the general objectives: - economic development, including tourism and thermal industry- environment preservation, including water quality and ecosystems protection- maintaining of the cultural patrimony, including traditional activities (shellfish farming, professional fisheries in the lagoon, recreational activities, etc.) NB: of course, these objectives generate internal conflicts • The local water management plan (SAGE) defines several specific objectives related to the environment policy. One specific objective is the reduction of the water microbiological contamination. The current political debate focuses the ways of translating these objectives into operational management options. • In this context, the main purpose of our SPICOSA experiment is twofold:- to assess the efficiency and the costs of new water treatment systems Cost-effectiveness analysis (1: restricted)- to estimate the impacts of various operational management options on the traditional activities and the local economy Multi-criteria analysis (2: extended)
Scenarios definition and system assessment The definition of scenarios and the assessment of the resulting states of the system will contribute to the local political debate in three different ways. • Designing the Water Policythe objective of the MC reduction has to be translated into operational objectives, in particular as regards the sanitary classification of the Lagoon (A or B) and the occurrence of commercial bans for the shellfish farming industry, according to the trends of the system (forcings)definition of scenarios = trends, operational objectives, technical options • Searching for the more efficient water treatment systems the assessment of possible new water treatment systems (technical options), as regards their costs and their ability to reach one particular operational objectives costs/effectiveness analysis of simple management options • Assessing the impacts of one operational policy objectives- on the regional economy, through the financial analysis of impacted sectors and the induced effects on the other industries and activities- on the broader development concerns (as set up by the SCOT), considering eventually additional management options for traditional activities selection of indicatorsmulti-criteria analysis of more complex management options
The economic dimensions Economic dimension 1:cost-effectiveness analysis of the water treatment systems, according to different technical options. Approach = investment and running costs of water treatment settlements, considering local public budget constraints Economic dimension 2: economic dynamics in the shellfish farming industry. Approach = financial analysis and the vulnerability of businesses to the closures of the shellfish farming area (period during which sales are forbiden) Additional management options to be tested in complex scenarios = re-allocation of the production capacity of the farms which stop their activity Economic dimension 3: a regional economy matrix will be used so as to provide macro-economic drivers and indicators at the site scale. Approach = incorporating direct (pressure and impacts) and indirect (induced effects) relationships between the environment and the macro-economic dynamics of the Thau Lagoon territory (economic feedback loops)
First results of OMEGA-THAU project • Investigations to : • Identify main E.coli sources (on watershed & onto the lagoon) • Estimate for each source (on watershed) E.coli daily load The watershed ecological modules • Every day permanent (and/or seasonal) populations & activities produce E.coli pollutions • These E.coli loads can be reduced (or not) by specific treatments • These reduced (or not) E.coli loads discharge into the lagoon via local streams What we need to achieve this goal in extend model ? To identify Main types of E.coli source on watershed To formulate (in an analytic way) E.coli daily load for each type of source
The watershed ecological modules In Extend model (in order to be as well generic as possible) we distinguish these 3 steps 3 different modules E.coli pollutions production blocks E.coli pollutions treatment blocks E.coli pollutions transfer blocks
Permanent population /seasonal population . Daily Produced E.coli load (Cell/d) . … During rainfall events Storm sewers SRC5 Dysfunctioning of sewage network system SRC6 The watershed modules E.coli pollutions production blocks Parameters read in Database For each town on watershed Nb. of Perm. Inh. Nb. of tourists living in houses connected to WWTP SRC1 % of pop. connected to WWTP Nb. of house with ind. WWT System living in houses with their own septic tanks SRC2 Seasonal population living in campings with their own WWT systems SRC3 Nb. of tourists in campings during summer Farming (poultry, horse,…) SRC4 Nb. of farms & Nb. of animals in each farm 1 Eq. Inh = 5,7x10 10 E.coli/d . For each type of SRC State variable saved in Database
The watershed modules E.coli pollutions treatment blocks Parameters and state variables read in Database For each SRC on watershed Daily Produced E.coli load Daily Produced E.coli load E.coli Abatement techniques (or not) Parameters for treatment method Daily Treated E.coli load </= Daily Produced E.coli load State variable saved in Database Empirical values for abatement in each WWTP depends on : For instance SRC1 Daily E.coli load produced by pop. connected to WWTP • Season (treatment is more efficient in summer) • Meteorological condition (by-pass during rainfall events) .
The watershed modules E.coli pollutions transfer blocks Parameters and state variables read in Database For each SRC on watershed Daily Treated E.coli load Daily Treated E.coli load Abatement in local stream depends on : E.coli Abatement due to natural processes during transfer in the local stream (from point source to the lagoon) • Distance from point source to the lagoon • Season (T90 in stream is higher in summer) • Meteorological condition (speed of stream higher during rainfall event) Daily Transferred E.coli load </= Daily Treated E.coli load State variable saved in Database .
The watershed modules E.coli pollutions transfer blocks In Watershed Database Number of tables (containing fields associated to Daily Produced,Treated and Transferred E.coli load) = numbers of SRC on the watershed Custom block Re-arrange daily E.coli load & create one Dynamic_Database per outlet that contains Total Daily E.coli load (sum of all E.coli load of all SRC on this watershed) and each component of this total load
The water treatment module • There are infinite technical ways for reaching the objectives fixed by stakeholders • creating new water treatment structures • modifying existing structures (size, technology) • improving the collection nets • management of punctual treatment under-capacity (storms) • But the aim of the model is to explore prospective scenarios, not to optimize a public policy
Operational use of the water treatment module by Extend • The water treatment module, associated with the hydrologic component, is integrated in the model following two complementary steps • 1st → Restrictive model : comparative assessment of water treatment options (several runs) • Selection of best possibilities considering general constraints : • total budget (operational and investment costs), land availability, opportunity costs, etc. • Comparative assessment of water treatment options • Hierarchical classification of each option by considering costs and abatement efficiency • 2nd → Global model: integration of the selected water treatment options in the prospective model • Strategic planning at long run in terms of investments • Estimation on global impacts in the model depending of selected scenarios
20 local streams on the watershed What is the impact of daily E.coli load discharges by each local stream on lagoon water quality ? First step : Simulate impact of E.coli discharge into the lagoon At each time step, at each REMI station (i = 1,9) ? 20 [E.coli] i = Fctn (S Daily E.coli load, Meteorological conditions) j=1 Lagoon contamination module INTO THE LAGOON National monitoring network (REMI) controls microbiological quality of oysters and mussels to determine category of shellfish production areas. 9 monitoring stations are sampling every first Monday of the month If E.coli concentration in shellfish passes a legal level, administration can decide to temporarily forbid shellfish harvesting Second step : Simulate surveillance procedure and regulation rules
Vent faible de secteur S-SE Lagoon contamination simulation using 3D model First step : Simulate impact of E.coli load discharge into the lagoon by each local streams using results of 3D-hydrodynamics model coupled to a biological module that simulate transport, dispersion, mortality of E.coli cells in water lagoon 100 m x 100 m grid 10 s level along vertical direction Calibration and validation of this 3D model achieve in the framework of OMEGA-THAU project
Load 1 load 1 load 2 load 1 & 2 [E.coli]c1 + [E.coli]c1 = [E.coli]c1 Load 2 Lagoon contamination simulation using 3D model Sensitivity studies with 3D- model shown 1) [E.coli] in water can be summed 2) High impact of wind conditions on [E.coli] in water No wind Daily E.coli load = 13 Log Wind conditions O-NO, 36 km/h 5 characteristics wind conditions are retained : 315N, 330N, 90N, 150N / 10m/s, No wind)
Pallas stream flow (m3/s) hours Lagoon contamination simulation using 3D model Sensitivity studies with 3D- model shown 3) High impact of temporal distribution of stream flow on [E.coli] in water Daily E.coli load = Stream flow x [E.coli]stream [E.coli] x Stream Flow = [E.coli] x Stream High x Low Lowx High E.coli discharge during dry weather E.coli discharge during rainfall event Daily E.coli load = 13 Log Wind conditions N-NO, 36 km/h 2 characteristics meteorological conditions are retained : dry period, rainfall event : 70 mm in one day
The governance module : regulation of sanitary risks due to the microbiologic water charge
The governance module : monitoring and regulation Risk of contamination (rainfall, incident, etc..) ? MONITORING ALERT Level 0 J = 1er Monday of the month If all values < Threshold (9/9) 9 sampling (REMI) Alert MONITORING J+1 If 1 value > Threshold (1/9) J = J détection du risque 9 sampling (REMI) ALERT Level 1 MONITORING J+2 If all values < Threshold (9/9) J = J+ 2 9 sampling (REMI) If 1 value > Threshold (1/9) Alert Level 2 MONITORING J = every monday All values (9/9), Must have 2 values < threshold (9/9) 9 sampling (REMI) If 1 value > Threshold (1/9)
The Shellfish farming module (1/3) • - Figuring the shellfish farming sector • Thau lagoon is the principal shellfish farming production area of the French Mediterranean • There are globally 540 companies that represent locally a source of direct employment for 2,000 workers (fulltime equivalent estimates). The global production can be estimated slightly higher than 20,000 tons by year and distributed into 60% of oysters and 40% of mussels • Companies are segmented into three categories depending on their production capacity. This capacity is directly linked to the number of concessions they own: • - Small companies (owning until 4 tables) • - Medium companies (owning 4-8 tables) • - Big companies (owning more than 8 tables)
The Shellfish farming module (2/3) - Rationale of the approach . No bioeconomic model (such as in SSA10) . Each commercial ban potential economic losses . Linking the production capacity by type of company, their representative market distribution structure and the selling prices practiced, it is possible to estimate the global revenue obtained by class of company in a “normal” year. . A normal year can be considered as an annual economic period with no sanitary closure events. Consequently, it translates the maximum revenue which can be obtained by shellfish companies in the absence of sanitary events.
The Shellfish farming module (3/3) • Expected output of the shellfish farming module • . The shellfish farming box of the model evaluates the economic impacts directly supported by companies due to microbiological water overcharge • . Estimation of the economic losses associated to commercial bans due to microbiologic peaks . Effects at short-run: determined by intra-annual economic dynamics and sanitary rules in the governance box • . Effects at mid and long-un: image impacts, economic sensibility of companies
The tourism industry • There are two ways to integrate the tourism industry in the model • (this question is actually under discusion) • - Endogenously (feed back): the site attractiveness generates a tourism demand • . The objective is to calibrate a function comparing data series of tourism frequentation and an indicator of water quality (sanitary closures as a proxy) • . Problem : in water quality other environmental components are included. Separability question • - Exogenously : if problems to assess an attractiveness function, the dynamics of the sector can be forced in the scenarios box
Conclusion: state of work • The modeling activities are going on • The model is not complete at the whole but some associated blocks are starting to run • Some modules of the model need to be quickly developed • High efforts have been made in restructuring the model, programming and integrating • We have some incertitude about additional information required for some processes but globally the structure of the model seems enough robust • Interaction with local stakeholders will be assured by our Spicosa colleagues participating to the expertise requirements of “Scot” and “Sage”