Controlling SAS Graphics using ANNOTATE Datasets
Controlling SAS Graphics using ANNOTATE Datasets. Elizabeth Campagna University of Colorado Denver Colorado Health Outcomes Program. Colorado Day – Denver SAS Users Group, September 25 2008. Outline. Why use ANNOTATE How to use an ANNOTATE dataset What is an ANNOTATE dataset Examples

Controlling SAS Graphics using ANNOTATE Datasets
E N D
Presentation Transcript
Controlling SAS Graphics using ANNOTATE Datasets Elizabeth Campagna University of Colorado Denver Colorado Health Outcomes Program Colorado Day – Denver SAS Users Group, September 25 2008
Outline • Why use ANNOTATE • How to use an ANNOTATE dataset • What is an ANNOTATE dataset • Examples • References
Why? • Enhancement and modification of graphical features - flexibility to add any drawing object or text, in any format or color, to any place on your graphical output • Position text labels in a graph • Create custom legends • Draw lines between points • Add symbols at specific locations
Create an ANNOTATE dataset Execute the ANNOTATE commands by including the following option in your SAS/GRAPH code SAS/GRAPH interprets and executes the drawing commands along with the graph and creates output that has both included PROC GPLOT data=apple / ANNOTATE=<ANNOTATE file name>; PLOT color*state; RUN; How?
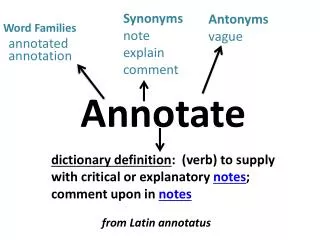
Ordinary SAS dataset Each observation is a drawing command defined by the values placed in each of the specific variables. Variables are constricted in values/attributes they can have Variables in an ANNOTATE dataset ALL information What is to be done? FUNCTION How is it to be done? COLOR, SIZE, STYLE, POSITION Where is it to be done? X, Y, XSYS, YSYS What?
What? FUNCTION variable tells SAS what to do, the other variables all modify, specify, or locate the function. . . .
Attributes (how) Attributes are RETAINED between functions unless re-defined
Dimensions (where) • X The numeric horizontal coordinate. • Y The numeric vertical coordinate. • Z For three-dimensional graphs, specifies the coordinate for the 3rd dimension. • XSYS The coordinate system for the X variable. • YSYS The coordinate system for the Y variable. • ZSYS The coordinate system for the Z variable (for three-dimensional graphs).
Dimensions (where) Example: XSYS=‘1’; YSYS=‘A’;
ANNOTATE MACROS • ANNOTATE macros within a SAS DATA step simplify the process of creating ANNOTATE observations. • Specify a function and assign variable values (attributes) in one step • You can mix assignment statements and macro calls in the same DATA step. • Execute: “%annomac;” to make ANNOTATE macros available
Example • How to draw lines, place symbols, & place text • Changing attributes • Illustrate the use of various coordinate systems • Use of ANNOTATE macros
SAS Code - ANNOTATE %annomac; data anno; length function color style $8 text $40; xsys='2'; ysys='2'; size=1; line=1; color='black'; set test; * plot Odds Ratios; function='symbol'; style='none' ; text='dot'; x=mid; y=grp; output; * add horizontal lines representing OR CI; function='move'; x=low; y=grp; output; function='draw'; x=up; y=grp; output; * add vertical lines at end of CI; %LINE (low, grp-0.05, low, grp+0.05, black, 1, 1); %LINE (up, grp-0.05, up, grp+0.05, black, 1, 1); * labels; function='label'; style="'Arial'"; size=1.5; x=low; y=grp; position="3"; text=grplabels; output; * use graphics output area for vertical positioning to set x-axis labels below data area; ysys='3'; position="5"; function='label'; size=1.75; x=0.3; y=11; text="Decreased Likelihood"; output; function='label'; x=3; text="Increased Likelihood"; output; run;
* plot Odds Ratios;function='symbol'; style='none' ; text='dot'; x=mid; y=grp; output;
* add horizontal lines representing OR CI;function='move'; x=low; y=grp; output;function='draw'; x=up; y=grp; output;
* add vertical lines at end of CI;%LINE (low, grp-0.05, low, grp+0.05, black, 1, 1); %LINE (up, grp-0.05, up, grp+0.05, black, 1, 1);
function='label'; style="'Arial'"; size=1.5; x=low; y=grp; position="3"; text=grplabels; output;
* use graphics output area for vertical positioning to set x-axis labels below data area;ysys='3'; position="5";function='label'; size=1.75; x=0.3; y=11; text="Decreased Likelihood"; output;function='label'; x=3; text="Increased Likelihood"; output;
SAS Code – Proc GPLOT goptions reset=all; goptions cback=white ctext=black ftitle='Arial' ftext="Arial" fby='Arial' htitle=2 htext=12 PT gsfname=plots device=gif xmax=6 IN ymax=4 IN; axis1 logbase=10 logstyle=expand order=(0.1 1 10) label=(font='Arial' height=12 PT justify=center ''); axis2 order=(0 to 4 by 1) /* change max axis value as needed (# grps + 1) */ color=white; symbol1 i=none; title 'Odds Ratios w/95% CI'; footnote 'Denver SAS Users Group Colorado Day 2008'; filename plots "H:\misc\DSUG\2008\plot1.gif"; proc gplot data=test; plot grp*up / anno=anno haxis=axis1 vaxis=axis2 href=1 noframe; run; quit; title; footnote;
References Introduction to SAS/Graph Michael Friendly Statistical Consulting Service http://www.psych.yorku.ca/lab/sas/sganno.htm SUGI 31, Paper 085-31 Improving Your Graphics Using SAS/GRAPH® ANNOTATE Facility David Mink, Ovation Research Group, San Francisco, CA David J. Pasta, Ovation Research Group, San Francisco, CA http://www2.sas.com/proceedings/sugi31/085-31.pdf Data Driven Annotations: An Introduction to SAS/GRAPH’s® ANNOTATE Facility Arthur L. Carpenter California Occidental Consultants http://www.caloxy.com/papers/67-HW03.pdf http://support.sas.com/onlinedoc/913/docMainpage.jsp SAS OnlineDoc 9.1.3 SAS/GRAPH Reference > The ANNOTATE Facility http://support.sas.com/onlinedoc/913/docMainpage.jsp