Biodiversity Implications of Forest Disturbance and Related Landscape Dynamics in the Brazilian Amazon
Biodiversity Implications of Forest Disturbance and Related Landscape Dynamics in the Brazilian Amazon. Mark A. Cochrane 1,2 , David P. Roy 1 , Carlos Souza Jr. 2 , Jos Barlow 3 , Eugenio Arima 4 , Izaya Numata 1 , Christopher P. Barber 1 , Luiz Mestre 1 , Rafael Andrade 1 , and Sanath Kumar 1.

Biodiversity Implications of Forest Disturbance and Related Landscape Dynamics in the Brazilian Amazon
E N D
Presentation Transcript
Biodiversity Implications of Forest Disturbance and Related Landscape Dynamics in the Brazilian Amazon Mark A. Cochrane1,2, David P. Roy1, Carlos Souza Jr.2, Jos Barlow3, Eugenio Arima4, Izaya Numata1, Christopher P. Barber1, Luiz Mestre1, Rafael Andrade1, and Sanath Kumar1 1 Geographic Information Science Center of Excellence, South Dakota State University, Brookings, SD USA 2 IMAZON, Instituto do Homem e Meio Ambiente da Amazônia, Belém, PA Brazil 3 Lancaster University, Lancaster United Kingdom 4 Hobart and William Smith Colleges, Geneva NY USA
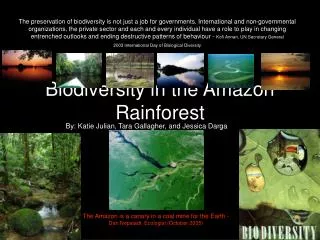
What is the project? The fundamental hypothesis underlying this project is that the biodiversity levels of Amazonian forests are strongly related to two competing factors: forest disturbance and time since last disturbance
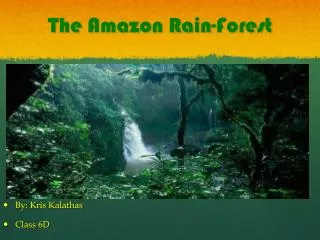
The Brazilian Amazon Amazon humid tropical forest biomes: ~ 6.4 km2 Portion in Brazil: ~ 4 km2 Source: WWF
Human Access to Forest 85% of deforestation within 50 km of main roads 73,000 km of official roads in region 240,000 km of unofficial roads Expansion rates > 40 km / 10,000 km2 / year Source: IBGE, IMAZON
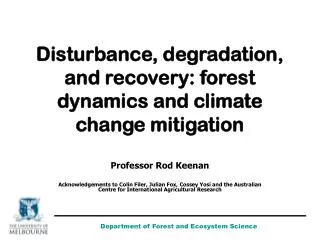
Forest wildfires: Interact with ongoing threats to the Amazon
How do we propose to test this? Our approach is straightforward… • 1) Determine recent forest disturbance history across the Brazilian Amazon (2000-2009); • 2) Conduct extensive field studies of indicator taxa, stratified by disturbance history, to determine biodiversity responses; • 3) Model the determinants of fire ignition and fire spread; • 4) Predict the current and future levels of biodiversity similarity in disturbed forests spatially across the Brazilian Amazon.
a) Paragominas,Pará State - 223/62 Phase 1. Imagery Acquisition and Processing Soil NPV GV NDFI
Landsat Landsat GV NPV Soil Shade Image Processing Steps (2) Build Spectral Library (1) PRE-PROCESSING Image Registration Radiance Conversion Estimate Visibility and water vapor Correct Haze? Reflectance Space Atmospheric Correction (ACORN) No Apply Carlotto’s Technique Yes Pixel Purity Index - (PPI) (4) Enhance and Detect Canopy Damage (3) SMA 40 million pixels NDFI CCA Visualization SVDC NDFI ≤ 0.75 Scatter matrix Spectral curves Extract Patios Canopy Damage Generic Image Endmembers Soil ≥ 10% 1 pixel ≤ Area ≤ 4 pixels GV + NPV + Soil + Shade = 1 Souza Jr. et al. (2005), RSE
Haze Correction Contaminated Image Corrected Image Ji-Parana, 231/67 – R3, G2, B1
-1 ≤ NDFI ≤1 NDFI low to moderate Low to moderate GV Moderate to high NPV and Soil NDFI near 1 High GV Low NPV and Soil Normalized Difference Fraction Index Souza Jr. et al. (2005), RSE
NDFI Roads Logged Forest 226/68 - 2001 (Sinop - MT)
NDFI 226/68 - 2000 (Sinop - MT)
NDFI 226/68 - 2001 (Sinop - MT)
NDFI 226/68 - 2003 (Sinop - MT)
Age map Time series Land cover map Age map 1 y 12 ys Forest 2 ys 13 ys 3 ys 14 ys Pasture 4 ys 15 ys 5 ys 16 ys S.G.Forest 6 ys 17 ys 7 ys 18 ys 1975 8 ys 19 ys 9 ys 20 ys >22 ys 10 ys 21 ys 2005 11 ys Derived from Landsat time series Used for calculation of fragmentation features
Persistence of Forest Edge (Ariquemes) Remaining edge %
Edge length classification using ISO data Class 1 Class 4 Class 2 2005 1994 1998 1975 1990 1988 1975 1986 1984 2004 1984 2002 1994 1993 1991 1975 1984 1992 1986 1988 1989 1990 1985 1987 2000 2002 1988 2000 1990 1992 1992 1994 1986 1996 2005 1996 2004 1998 2000 1997 1999 1995 1996 1998 2002 2003 2001 2005 2004
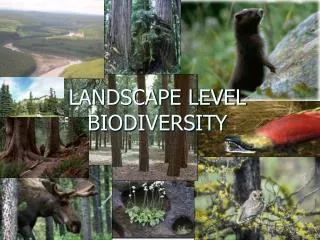
Phase 2. Biodiversity Field Studies • The spatial database of forest disturbance is used to stratify and interpret our field studies investigating the response of 4 major indicator taxa (birds, dung beetles, trees and ants) as a function of disturbance history and time since last disturbance.
Both birds and dung beetles are good indicators of community change in most other faunal groups Barlow et al. 2007 PNAS
Both birds and dung beetles hold large numbers of species that are restricted to primary forest Many wide ranging species Mostly territorial or habitat specialists Barlow et al. 2007 PNAS
Both birds and dung beetles are highly cost effective to sample – you get good information on habitat integrity for a low cost Birds Dung beetles Moths Small mammals Gardner, Barlow et al. 2008 Ecology Letters
Selecting effective biodiversity indicators • Wide variability in cost of surveying different taxa • Some taxa (e.g. birds and dung beetles) are of high performance for evaluating forest management systems in the Brazilian Amazon because they: • Are sensitive indicators of changes in forest integrity • Can be surveyed cost effectively • Ants share similar ecological attributes as birds and dung-beetles • They are cheap to sample • Species rich, with many different functional groups • Most do not move large distances from their colonies (if you find them in a habitat, they come from that habitat).
Methods – Dung Beetles • Baited pitfall traps (human faeces) • 5 traps per transect, run for 4 days. • Follows methods discussed at global Scarabnet meetings, and used effectively in many Amazonian studies • Complemented by un-baited flight intercept traps
Fire-mediated dieback and compositional cascade Barlow and Peres 2008
POINT COUNTS Observation and recording 10 point counts per day per site 06:30 h - 09:00 h 10 min. bird observation and recording, spaced at least 150m each other, intending to avoid double bird-counting (Parker, 1991). Along each mist-net transects and other trails.
MIST NETS Less individuals sampled compared to point counts BUT It is independent of observer accuracy Capture mainly understory birds Samples species that are not singing Possibility to mark (banding) and measure
MEASURING We will measure: Wings Tarsus Bill Weight
Expected Results A large-scale comparison of effects of fire on Amazonian bird communities. A long-term comparison of effects of fire on Amazonian bird communities. One of the best overviews comparing Amazonian bird communities in different Amazonian States (~500 sp).
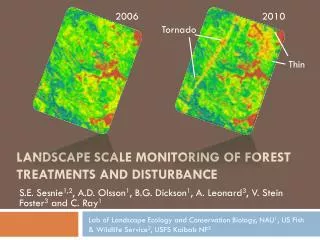
Phase 3: Characterizing Fires (Starting June 2008) • Integration of Landsat based analyses of forest disturbance with MODIS-derived fire products will enable us to accurately separate fires into their three main types; • (1) deforestation fires, where slash is burned, creating relatively hot fires that burn for several hours; • 2) maintenance fires, which rapidly burn as narrow fire lines through grass and early second growth; • 3) forest fires, escaped fires in standing forests which vary from extremely low intensity in previously undisturbed forests to high intensity in previously burned or logged forests
Phase 4: Spatio-socioeconomic modeling (starting June 2008) • We will use spatial regressions of economic (farmgate prices for soybean and beef), physical-geographic (precipitation, soil types, vegetation types, distance to previous deforestation, and land protection status (e.g. indigenous lands, conservation units)) and land cover (disturbance history) factors to model probability surfaces of fire ignition and fire spread. • MODIS fire detections will be used to validate the ignition event model for 2000-2009 and the composite burned area product (Phase 3) will be used to validate the fire spread model over the same time period. • Once validated, the models will be run using likely economic and rainfall scenarios to create spatio-temporal predictions of disturbance frequency and expected biodiversity impacts for the 2010-2019 time period.
Reprise of Project Objectives • Develop a basin-wide spatial database of all forest disturbance (selective logging, fragmentation, fire, deforestation) from 2000-2009, based on NDFI analyses of annual Landsat imagery. • Derive regional estimation functions of expected biodiversity similarity based on disturbance history (disturbance metric) and time-since-last-disturbance (resilience metric) derived from stratified field data collected for four separate taxa (woody plants, birds, dung beetles and ants). • Develop a basin-wide spatial and temporal datasets of all fires by type (1) deforestation fires; 2) maintenance fires; 3) forest fires, using MODIS and Landsat data. • Model economic, physical-geographic and land cover factors affecting fire ignition and spread from 2000-2009 to create probability surfaces of fire ignition and fire spread. • Create a basin-wide map of probable biodiversity alterations in current standing forests across the Brazilian Amazon and predictions of future changes in these conditions over the next 10 years (2010-2019) based on likely economic and climate scenarios. (Starting late 2009)
Project Fire X Amazon Biodiversity