Mass Marking and Mark-Selective Fisheries
300 likes | 566 Views
Mass Marking and Mark-Selective Fisheries. Black and White Choice, or Complex Shades of Grey?. David Hankin Department of Fisheries Biology Humboldt State University. Background Perspective (DGH).

Mass Marking and Mark-Selective Fisheries
E N D
Presentation Transcript
Mass Marking and Mark-Selective Fisheries Black and White Choice, or Complex Shades of Grey? David Hankin Department of Fisheries Biology Humboldt State University
Background Perspective (DGH) • Hatchery Reform Efforts are to be Commended and are Especially Needed at CV Hatcheries (Hankin 1982, Asilomar conference). • Mass Marking (MM = 100% AD-clip + some smaller fraction with CWT) is not clearly a “hatchery reform” measure. • It’s hard to imagine implementation of MM (as defined above) without Mark-Selective Fisheries (MSF). • MM & MSF raise very serious issues. • Other CV hatchery reform efforts seem much more critical (e.g., eliminate off-site releases – Klamath vs CV fall Chinook genetic differences among stocks; reconsider “random mating”)
Coordination of Presentations • Hankin (HSU): Overview of hatchery marking programs; Intention of MM; serious issues raised by MM & MSF (PSC Expert Panel); DIT?; Estimation vs “Imputation” • O’Farrell (NMFS/PFMC) - MM&MSF Assessment and Management Issues; ESA-listed stocks; “Disaster Prevention?” • Phillips (CDFG) – Logistics, costs and feasibility of recovery programs under MM & MSF
Historical Perspective on Hatchery Marking Programs for Chinook Salmon • Individual groups of fish were tagged (fin clips) primarily to assess relative performance of different rearing and release strategies. • No serious attempts or apparent interest in marking to allow identification of hatchery fish or separation of wild from hatchery fish. • High variability in marking programs across years within hatcheries and across hatcheries; generally impossible to reliably estimate hatchery contribution to returns.
Development of Coded-Wire Tags • In mid-70’s, AD-CWT combination, combined with rigorous ocean and freshwater escapement sampling programs (e.g., Klamath R.) allowed cohort reconstruction/analysis. • Cohort Analysis: Fishery exploitation rate analysis; survival rates; maturation rates; but not hatchery contribution due to variability in marking levels.
By 2004: CWT System Summary statistics (Johnson, K. 2004) • 54 state, federal, tribal and private entities in USA and Canada conduct CWT experiments – 1200 new codes annually; • > 50 million juvenile salmon and steelhead tagged annually (cost > $7.5 million); • About 275,000 CWTs recovered each year (cost $12-13 million); • Used for many purposes – evaluate success of hatchery practices; ocean distributions; serve as proxy for fishery impacts on unmarked wild fish
Key Assumptions and Requirements of Coastwide CWT Recovery Program • Adipose fin clip sequestered as a mark to be used ONLY for presence of CWT • Indicator Stock Idea: Fate (fishery impacts) of hatchery fish with AD+CWT assumed to be same as that of “nearby” wild population with similar life history, run timing • AD+CWT releases were not designed to allow estimation of overall contribution of hatchery fish to escapement → % Hatchery fish unknown.
Key Advantage of CWT Releases • “Enrichment” of small populations in ocean catch sampling: • Assuming equal survival of two 200,000 fish release groups, expected ocean catches of CWT’d fish should be similar even when size of populations from which CWT groups originated may differ by order of magnitude • Very advantageous for assessment of small natural populations (assuming appropriate proxy). Example: Sacto winter Chinook. NOTE – MM (100% AD-clip) eliminates “enrichment”.
Reliable Estimation of the Proportion of Hatchery Fish in Spawning Runs: Constant Fractional Marking (Hankin 1982) • Allow existing AD+CWT programs to continue. • Mark a constant fraction of remaining “production” releases with fin clip. • c=1/(fraction marked)
Implementations of CFM • 1979-1982 BYs: Iron Gate and Trinity River hatcheries (Klamath system) – fin-clip 1/3 of all releases in excess of AD+CWT (Hankin 1982); • 1999 BY – present: Trinity River Hatchery – 25% of all releases receive AD+CWT (Hankin & Newman 1999); • 2007 BY– present: CV hatcheries – 25% of all releases in excess of “experimental” CWT groups receive AD+CWT (Hicks, Newman and Hankin 2005)
Purposes of 100% Marking • Historical: Provide fishing opportunities on hatchery fish (e.g., steelhead) while reducing impacts on wild fish: N. Umpqua, OR steelhead - “If he’s wild, let him go”.
Other Purposes of 100% Marking • Contemporary theme – • To allow control of % hatchery fish among hatchery spawners and among naturally spawning fish in an integrated hatchery/natural population system (HSRG 2004) • Note: Implicitly assumes on-site releases of hatchery fish (to reduce straying across populations) and system of weirs or similar structures to allow separation of types on natural spawning grounds.Is that likely in the CV in the near future???
Mass Marking and Mark-Selective Fisheries: Implementation for Pacific Salmon • In current mass marking procedures, ALL hatchery fish receive an adipose fin clip, but many (most) of these fish are released without CWTs: • (Norm Dicks, D-Wash, 2003): “The United States Fish and Wildlife Service shall, in carrying out its responsibilities to protect threatened and endangered species of salmon, implement a system of mass marking of salmonid stocks, intended for harvest, that are released from Federally operated or Federally financed hatcheries including but not limited to fish releases of coho, chinook, and steelhead species. Marked fish must have a visible mark that can be readily identified by commercial and recreational fishers."
Achieving mass marking has required development of new (and expensive) automated tagging technologies: AutoFish system from Northwest Marine Technology is capable of automated removal of the adipose fin and/or insertion of a CWT. Each fish is sorted by size, clipped and/or tagged, and returned to the pond in about 5 seconds.
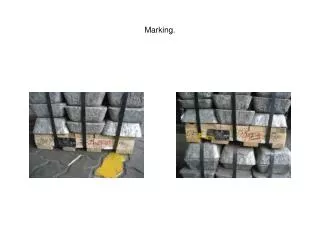
Mass Marking also introduces new complications wrt sampling catches and escapements for CWT’d fish because now not all ad-clipped fish have CWT and it would be foolish to collect heads from all AD-clipped fish to search for non-existent CWTs. Tube (left) and Wand (right) CWT detectors
More complications from MM and MSF • In mark-selective fisheries (MSF), only ad-clipped (known hatchery) fish may be retained, theoretically leading to reduced fishing mortality on weak (e.g. ESA-listed) natural stocks. • BUT: there must also be some ”non-catch” hook & release mortality on unmarked (natural) fish in MSF. • Recovery patterns of CWT’d hatchery indicator stocks have routinely been used to infer exploitation rates experienced by associated natural stocks. • BUT: with MSF, recovery patterns of marked hatchery fish are no longer the same as for the associated unmarked natural stocks.
PSC Expert Panel Findings (2005) • 6. Mass Marking (MM) and Mark-Selective Fisheries (MSF) together pose serious threats to the integrity of the CWT system. The PSC has been alerted to these threats since at least 1991. In particular: A. Recovery patterns of adipose-clipped fish no longer indicate recovery patterns for unmarked natural stocks (see O’Farrell talk); B. Significant practical and statistical issues are raised by the need to find Ad+CWT fish when many MM fish are released with Ad clip only. (see Phillips talk)
These Concerns are not new • 1991 letter to Director General, Pacific Region, and Director (WFDW) noted 7 different significant issues (problems) that were raised by MM and MSF. (See EP Report) • Letter was sent by Co-Chairs of PSC’s CTC (Chinook Technical Committee: Jim Scott (WDFW), Norma Sands (US), Brian Riddell (DFO)
Observable and Unobservable Mortalities of DIT Groups DIT to the Rescue???Double Index Tagging: Two groups receive CWT, but only one group is AD-clipped. MARKED = + + = + + NSF MSF Escapement ??? UNMARKED
PSC Expert Panel Findings (2005) • 7. For coho and Chinook salmon, it appears possible to estimate total non-catch mortalities at age in all MSFs from a full cohort analysis of paired DIT (double-index tagged) releases, IF complete recovery data can be collected for DIT groups. However, we could not derive an unbiased method to allocate total non-catch mortalities over a set of MSFs. It is therefore impossible to guess where and when non-catch impacts take place.
Hankin’s Main Concern • In the absence of successfully executed DIT experiments (there have been none so far for Chinook of which I am aware – see Expert Panel report), non-catch mortalities to natural stocks would have to be “imputed” based on a sequence of suppositions and assumptions. This is not equivalent to estimation from observed data!
Imputation Vs Estimation: What’s the Difference? • Imputed Non-Catch Mortalities: - Assume (i.e., “make up”): • Known contact rate • Known shaker mortality rates (sport vs comm.) • Independence of mortality if multiple releases of same fish • Estimated N-C M (i.e., let data speak): • Statistical analysis of recovery data (for DIT groups?)
An Extreme Example of “Imputation” • Guessing the probability of a nuclear plant meltdown (as in guessing non-landed mortalities in MSF): • Assume that all events leading to a meltdown are statistically independent of one another → meltdown is highly improbable; vs • But, what if events are not independent, but one failure causes other failure events to be more likely → not so improbable • Frequentist approach (based on observed metdowns) is unsuitable for meltdowns (i.e., wait for meltdowns?), but is feasible for fish! Guessing is not acceptable if there is a better way.
MM: Asking the Hard Questions • Q. If the purpose of MM is not to support MSF, but to support “hatchery reform”, then why remove AD fins from all fish? • A. Removal of AD fin is not needed to develop integrated hatchery programs. Instead, say, 25% could be AD+CWT for assessment purposes and remaining unmarked fish could receive blank wire. On return to FW, tubes (hatcheries) and wands (weirs) could be used to separate wild from hatchery fish (M. Mohr).
MM&MSF: Asking the Hard Questions • Observation: For a number of reasons, especially for commercial fisheries, MSF only makes sense, theoretically, when there is a high proportion of tagged fish among those likely to be contacted by a fishery (say, > 70%). (Commercial fishermen have formally complained about MSF in PSC ocean fisheries with low mark rates.)
Follow-up Q. For CV Chinook, what kind of future ocean contribution do we want to see from naturally produced as compared to hatchery fish? Does it make sense to promote a fishery type that makes no sense in the context of the future that we would like to see? How easy would it be to stop a large-scale implementation of MSF in Central CA ocean fisheries once it had started?