Download
1 / 29
291 likes | 316 Views
Understanding Axis Nifty IT Index Fund

E N D
Global Technology Demand While many industries are slowing, demand for Global IT services has grown significantly Annual Contracts Issued/ Renewed Demand for Global IT services 300 281 1,600 1,400 250 1,200 200 in USD billion 1,000 168 800 150 600 400 100 200 50 0 CY14 CY15 CY16 CY17 CY18 CY19 CY20 CY21 CY22 CY23E CY24E 0 CY18-20 CY21-23E Source: Gartner, ICICI Sec, Axis MF Research. Data as on 31st May 2023. E- Estimates Past performance may or may not be sustained in the future. Sector(s) mentioned above are for the purpose of illustration and should not be construed as recommendation. The above graph is used to explain the concept and is for illustration purpose only and should not used for development or implementation of an investment strategy. 3
Changing Frontiers New age technologies driving incremental growth. Covid a significant trigger Technology platforms like cloud computing, enterprise solutions & AI are driving incremental growth for the sector Use of Software as a Service and other machine driven services (Hyperscalers) has grown exponentially. Indian companies which have invested extensively in capabilities have seen larger client additions/order wins Global cloud ecosystem drivers – Hyperscalers & SaaS revenue trend 80 (USD bn) 6.2 70 AWS Salesforce Adobe SAP Cloud ServiceNow Workday 5.1 60 13.8 50 4.3 10.4 2.1 3.6 40 17.6 8.9 4.3 15.8 2.8 7.8 7.3 30 12.9 5.9 10.5 11.2 20 1.6 9.0 3.3 1.2 31.0 26.5 2.5 5.9 10 21.3 4.8 17.5 17.1 13.3 8.4 6.7 0 0.0 CY18 0.0 CY19 0.0 CY20 0.0 CY21 0.0 CY22 CY15 CY16 CY17 Source: ICICI Sec, Axis MF Research. Data as on 31st May 2023. Past performance may or may not be sustained in the future. Sector(s) mentioned above are for the purpose of illustration and should not be construed as recommendation. The above graph is used to explain the concept and is for illustration purpose only and should not used for development or implementation of an investment strategy. 4
How do Indian Players Stack Up? Pivot from traditional services paying off TCS and Infosys has helped with large scale transformation of companies Enabled clients to effectively manage disruptions Infosys: % of Revenue from Digital TCS: % of Revenue from Digital 70% 35% 62% 33% 59% 60% 30% 50% 45% 25% 25% 40% 34% 20% 18% 30% 24% 16% 15% 13% 20% 10% 10% Q3FY18 Q1FY16 Q2FY16 Q3FY16 Q4FY16 Q1FY17 Q2FY17 Q3FY17 Q4FY17 Q1FY18 Q2FY18 Q4FY18 Q1FY19 Q2FY19 Q3FY19 Q4FY19 Q1FY20 Q2FY20 Q3FY21 Q1FY18 Q2FY18 Q3FY18 Q4FY18 Q1FY19 Q2FY19 Q3FY19 Q4FY19 Q1FY20 Q2FY20 Q3FY20 Q4FY20 Q1FY21 Q2FY21 Q4FY21 Q1FY22 Q2FY22 Q3FY22 Q4FY22 Q1FY23 Q2FY23 Q3FY23 Q4FY23 Source: Goldman Sachs, HDFC Sec, Bloomberg, Axis AMC Research. Data as on 31st May 2023. Past performance may or may not be sustained in future. The sector(s)/stock(s)/issuer(s) mentioned in this presentation should not be construed as any research report/recommendation to buy / sell / hold. The above graph is used to explain the concept and is for illustration purpose only and should not used for development or implementation of an investment strategy. The stocks may or may not be part of our portfolio/strategy/ schemes 5
Recognizing Indian Capability Good Execution = Happy Customers Indian IT Scores High on most project execution parameters Execution Innovation Overall HFS Top 10 Position Breadth & depth of capabilities Rank Scale and growth Talent and delivery Partner ecosystem Overall execution Strategy and vision Technology Innovation Overall Innovation Change agents 1 Cognizant Cognizant Accenture Accenture Capgemini Infosys TCS Infosys Infosys Infosys 2 Accenture Cognizant Cognizant Cognizant Cognizant IBM Cognizant Accenture Infosys Infosys 3 Accenture IBM Capgemini Accenture Accenture Cognizant Infosys Infosys HCL HCL 4 IBM IBM Accenture Cognizant IBM Accenture Accenture IBM Infosys TCS 5 EY Capgemini Capgemini EY Capgemini Capgemini TCS Wipro TCS Infosys 6 Capgemini IBM IBM Capgemini Cognizant IBM TCS TCS HCL HCL 7 Capgemini IBM EY EY Wipro HCL Wipro Wipro HCL LTI 8 Capgemini Wipro Tech Mahindra HCL Wipro HCL TCS Wipro Wipro Wipro 9 EY HCL HCL Tech Mahindra Tech Mahindra Tech Mahindra Wipro TCS TCS TCS 10 EY EY EY EY LTI Tech Mahindra LTI LTI LTI LTI Source: Motilal, HFS Research, Axis AMC Research. Data as on 28th February 2022. Past performance may or may not be sustained in future. The sector(s)/stock(s)/issuer(s) mentioned in this presentation should not be construed as any research report/recommendation to buy / sell / hold. The fund’s exposure will be determined by the weight of underlying companies in the NIFTY IT Index. 6
Indian IT continues to gain share India’s IT+BPM exports have outperformed global IT services growth YoY growth (USD terms) FY17 FY18 FY19 FY20 FY21 FY22 Indian IT Services + BPM exports 7.7% 6.5% 7.1% 6.7% 2.7% 16.5% Global IT Services growth 3.2% 4.1% 6.7% 6.0% 1.7% 12.8% Outperformance in the growth (India - Global) 4.5% 2.4% 0.5% 0.6% 1.0% 3.7% Led by stable deal win momentum ($ mn) Expect revenue growth rebound in FY25e Source: ICICI Sec, Axis AMC Research. Data as on 31st May 2023. Past performance may or may not be sustained in future. The sector(s)/stock(s)/issuer(s) mentioned in this presentation should not be construed as any research report/recommendation to buy / sell / hold. The above graph is used to explain the concept and is for illustration purpose only and should not used for development or implementation of an investment strategy. 7
The Result Indian companies gaining market share Consistent Market-share Gains By Indian IT 5% 6% 7% 8% 9% 11% 13% 15% 17% 19% 20% 21% 22% 23% 25% 26% 26% 27% 27% 95% 94% 93% 92% 91% 89% 87% 85% 83% 81% 80% 79% 78% 77% 76% 74% 74% 74% 73% FY11 FY20 FY05 FY06 FY07 FY08 FY09 FY10 FY12 FY13 FY14 FY15 FY16 FY17 FY18 FY19 FY21 FY22 FY23 International Players Indian Players Source: ICICI Sec, Axis AMC Research. Data as on 31st May 2023. Past performance may or may not be sustained in future. The sector(s)/stock(s)/issuer(s) mentioned in this presentation should not be construed as any research report/recommendation to buy / sell / hold. The above graph is used to explain the concept and is for illustration purpose only and should not used for development or implementation of an investment strategy. 8
Why IT now? Indian IT gained share during GFC as cost takeout becomes focus Forecasts suggests acceleration in IT services spends in CY23 2023 IT Spending Forecast 14,00,000 10 8.3 9.1 7.9 8 13,60,000 6 5.5 13,20,000 4 12,80,000 2 12,40,000 0 IT Services (Octl-22 Forecast) IT Services (Jan-23 Forecast) IT Services (Apr-23 Forecast) IT Services (Jul-22 Forecast) Spending 2023 (USD, mn) Growth Deal wins were robust along with reasonable confidence on growth Clients reprioritizing their spends and substituting digital transformation initiatives for cost-take measures More cost takeout deals leads to more offshoring- better for Indian IT Source: ICICI Sec, Axis AMC Research. Data as on 31st May 2023. Past performance may or may not be sustained in future. The sector(s)/stock(s)/issuer(s) mentioned in this presentation should not be construed as any research report/recommendation to buy / sell / hold. The above graph is used to explain the concept and is for illustration purpose only and should not used for development or implementation of an investment strategy. 9
Bounced back stronger than market Lower correlation with broader markets provide the defence against market drawdowns GFC Taper Tantrum Covid 150 190 150 140 170 130 130 150 110 120 130 110 90 100 110 70 90 90 80 50 70 70 50 30 60 Jul-20 Apr-20 Jun-20 May-20 Nov-20 Jan-20 Mar-20 Dec-20 Jan-21 Mar-21 Feb-20 Aug-20 Sep-20 Feb-21 Oct-20 Jul-08 Jul-09 Nov-09 May-08 May-09 Mar-10 Nov-08 Jan-08 Mar-08 Jan-09 Mar-09 Jan-10 Sep-08 Sep-09 Jul-12 Jul-13 Jul-11 Apr-11 Apr-12 Apr-13 Apr-14 Jan-11 Jan-12 Jan-13 Jan-14 Oct-11 Oct-12 Oct-13 NIFTY 50 - TRI NIFTY IT - TRI NIFTY 50 - TRI NIFTY IT - TRI NIFTY 50 - TRI NIFTY IT - TRI Drawdown Return 1 year from lowest point Drawdown Return 1 year from lowest point Drawdown Return 1 year from lowest point NIFTY IT TRI -52% 153% NIFTY IT TRI -19% 57% NIFTY IT TRI -24% 52% NIFTY 50 TRI -59% 74% NIFTY 50 TRI -25% 18% NIFTY 50 TRI -36% 17% Source: niftyindices.com, Axis MF Research, Data as of 31st May 2023. Past performance may or may not be sustained in future. The sector(s)/stock(s)/issuer(s) mentioned in this presentation should not be construed as any research report/recommendation to buy / sell / hold. The above graph is used to explain the concept and is for illustration purpose only and should not used for development or implementation of an investment strategy. 10
Performance Consistent performance – Ideal for Long Term Wealth Creation NIFTY IT - TRI NIFTY 50 - TRI NIFTY 500 - TRI Winner among sectors (10 year CAGR %) Year 2004 2005 2006 2007 2008 2009 2010 2011 2012 2013 2014 2015 2016 2017 2018 2019 2020 2021 2022 CAGR 26% 34% 40% -11% -54% 168% 31% -17% 0% 60% 20% 2% -5% 15% 26% 11% 58% 62% -24% 16% 13% 39% 42% 57% -51% 78% 19% -24% 29% 8% 33% -3% 4% 30% 5% 13% 16% 26% 6% 14% 21% 39% 36% 65% -57% 91% 15% -26% 33% 5% 39% 0% 5% 38% -2% 9% 18% 32% 4% 14% Nifty IT 18.5 Nifty Financial Services 15.1 Nifty MNC 15.1 Nifty Bank 14.2 Nifty Energy 14.0 Nifty India Consumption 13.8 Nifty Metal 13.3 Nifty FMCG 12.9 Nifty Auto 12.7 Nifty Infrastructure 10.5 Nifty Realty 9.0 Nifty Pharma 7.2 Outperformed 9 out of 19 years Source: niftyindices.com, Axis MF Research, Data as of 31st May 2023. Past performance may or may not be sustained in future. The sector(s)/stock(s)/issuer(s) mentioned in this presentation should not be construed as any research report/recommendation to buy / sell / hold. The above graph is used to explain the concept and is for illustration purpose only and should not used for development or implementation of an investment strategy. 11
Performance 10 Years 7 Years 5 Years (31/05/2018 – 31/05/2023) Performance (31/05/2013 – 31/05/2023) (31/05/2016 – 31/05/2023) 12,00,000 8,40,000 6,00,000 Total Amount Invested 28,78,008 16,27,908 9,16,943 Market value as on April 30, 2023 16.68% 18.82% 17.01% NIFTY IT Returns (Annualised) 13.32% 14.01% 14.91% NIFTY 50 Returns (Annualised) 13.72% 13.99% 15.49% NIFTY 500 Returns (Annualised) Assuming Rs. 10,000 invested systematically on the first business day of every month over a period of 10,7,5 years respectively Source: niftyindices.com, Axis MF Research, Data as of 31st May 2023. Past performance may or may not be sustained in future. For illustrative purpose only Returns greater than 1 year period are compounded annualized. The above returns are computed after accounting for the cash flow by using XIRR method (investment internal rate of return). *Note - The above investment simulation should not be construed as a promise on minimum returns and safeguard of capital. 12
NIFTY IT premium has come off sharply Sector valuations (vs Nifty or Nasdaq) are reverting to historical averages Nifty IT PE Premium to Nifty PE 60% Nifty IT vs Nifty PE Average +1 SD -1 SD 40% 20% 0% -20% May/07 May/08 May/09 May/10 May/11 May/12 May/13 May/14 May/15 May/16 May/17 May/18 May/19 May/20 May/21 May/22 May/23 Nifty IT Premium to Nasdaq 50% Nifty vs Nasdaq Average +1 SD -1 SD 30% 10% -10% -30% -50% May/07 May/08 May/09 May/10 May/11 May/12 May/13 May/14 May/15 May/16 May/17 May/18 May/19 May/20 May/21 May/22 May/23 Source: ICICI Sec, Axis AMC Research. Data as on 31st May 2023. Past performance may or may not be sustained in future. The sector(s)/stock(s)/issuer(s) mentioned in this presentation should not be construed as any research report/recommendation to buy / sell / hold. The above graph is used to explain the concept and is for illustration purpose only and should not used for development or implementation of an investment strategy. 13
Summary: IT Sector Macro: Macro headwinds are driving slowdown in client decision making and thereby growth for Indian techs through the past 1-2 quarters Order bookings for Indian techs has held up well (cost takeout deals) despite macro weakness Expect recovery in revenue momentum from second half of FY24 • • • Demand: Consultant data also indicates that long term IT demand should be robust Indian IT tends to gain share during phases of spend optimization as evident from prior down cycles. e.g. GFC , Tech Bust period Use of AI/ML can lead to increased IT services demand as seen in the case of digital wave • • • Valuation: Valuations have come off over the past 12 months Nifty IT premium to NIFTY and Nasdaq has also come off significantly Companies are at discount to last 3/5 year average multiples • • • Source: Axis AMC Research. Data as on 31st May 2023. Past performance may or may not be sustained in future. The sector(s)/stock(s)/issuer(s) mentioned in this presentation should not be construed as any research report/recommendation to buy / sell / hold. The above graph is used to explain the concept and is for illustration purpose only and should not used for development or implementation of an investment strategy. 14
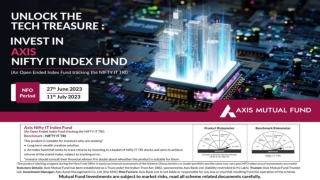
Introducing Axis NIFTY IT Index Fund (An Open Ended Index Fund tracking the NIFTY IT TRI)
Axis NIFTY IT Index Fund Take exposure to strong IT companies with global presence 9.51% 23.99% 9.76% 26.44% 8.83% HCL Tech Mahindra Axis NIFTY IT Index Fund TCS Infosys Wipro Technologies Rs. 10* 2.00% 4.84% 3.01% 3.06% 8.56% L&T Persistent Systems LTIMindtree MphasiS Coforge Technology Source; NSE, Axis MF Research Holding % data taken as on 31st May 2023. *Face value of the fund. The sector(s)/stock(s)/issuer(s) mentioned in this presentation should not be construed as any research report/recommendation to buy / sell / hold. 16
About NIFTY IT Index NIFTY IT Index Parameters India’s Information Technology (IT) industry plays a major role in the Indian economy. Index Inception Date P/E P/B Dividend Yield 01-Jan-96 25.5 8.21 2.07% With exports of over US$ 194 billion annually, the information technology space is the largest single service exporter industry in India. Number of Stocks Top Stock Weight (%) 10 26.44% Standard Deviation Correlation (NIFTY 50) Beta (Nifty 50) 23.27 0.66 0.97 NIFTY IT Index comprises of the 10 largest IT companies by free float market capitalization listed on NSE Source: niftyindices.com. NSE, HDFC Securities, Axis MF Research, Data as of 31st May 2023. Standard Deviation is calculated for 5 years. Past performance may or may not be sustained in future. Sector(s) mentioned above are for the purpose of illustration and should not be construed as recommendation. 17
Dividend paying companies Dividend yield Dividend yield - Historical IT 2.07 3.50 FMCG 1.95 3.00 INDIA MANUFACTURING 1.69 INFRASTRUCTURE 1.38 2.50 SERVICES 1.24 INDIA CONSUMPTION 1.17 2.00 PHARMA 1.02 1.50 AUTO 0.94 FINANCIAL SERVICES 0.9 1.00 BANK 0.78 0.50 MEDIA 0.73 REALTY 0.29 NIFTY Index NIFTYIT Index Source: niftyindices.com, Axis MF Research, Data as of 31st May 2023. . Past performance may or may not be sustained in future. The sector(s)/stock(s)/issuer(s) mentioned in this presentation should not be construed as any research report/recommendation to buy / sell / hold. The above graph is used to explain the concept and is for illustration purpose only and should not used for development or implementation of an investment strategy. 18
Axis NIFTY IT Index Fund An Open Ended Index Fund tracking the NIFTY IT TRI Benchmark Nifty IT TRI Index Minimum Investment (NFO) Rs. 5,000 and in multiples of Rs. 1/- thereafter Exit Load 0.25% if redeemed / switched out within 7 days from the date of allotment/ Investment Scheme Name Axis NIFTY IT Index Fund Category Index Fund NFO Price Rs. 10 Fund Manager Hitesh Das Kindly refer SID & KIM uploaded on the website <www.axismf.com>. 19
Basket of passive products Broad Market Fixed Income Sectoral/ Thematic Axis Nifty AAABond Plus SDL Apr 2026 50:50 ETF Axis NIFTY ETF Axis NIFTY Bank ETF Axis NIFTY 100 Index Fund Axis CRISIL IBX 70:30 CPSE Plus SDL April 2025 Index Fund Axis NIFTY IT ETF Axis NIFTY 50 Index Fund Axis CRISIL IBX SDL May 2027 Index Fund Axis NIFTY Healthcare ETF Axis NIFTY Midcap 50 Index Fund Axis Nifty SDL September 2026 Debt Index Fund Axis NIFTY India Consumption ETF Axis NIFTY Smallcap 50 Index Fund Axis NIFTY IT Index Fund Axis CRISIL IBX 50:50 Gilt Plus SDL June 2028 Index Fund Axis S&P BSE SENSEX ETF Axis NIFTY NEXT 50 Index Fund Axis CRISIL IBX 50:50 Gilt Plus SDL September 2027 Index Fund Please refer to our website www.axismf.com for more information. 20
Product Labelling Axis NIFTY IT Index Fund (An Open Ended Index Fund tracking NIFTY IT Index) This product is suitable for investors who are seeking*: • Long term wealth creation solution • An index fund that seeks to track returns by investing in a basket of Nifty IT TRI stocks and aims to achieve returns of the stated index, subject to tracking error. *Investors should consult their financial advisers if in doubt about whether the product is suitable for them. NIFTY IT TRI The product labelling assigned during the New Fund Offer is based on internal assessment of the Scheme Characteristics or model portfolio and the same may vary post NFO when actual investments are made 21
Disclaimer, Statutory Details and Risk Factors Disclaimer: Past performance may or may not be sustained in the future. Past performance may or may not be sustained in the future. Sector(s) / Stock(s) / Issuer(s) mentioned above are for the purpose of disclosure of the portfolio of the Scheme(s) and should not be construed as recommendation. The fund manager(s) may or may not choose to hold the stock mentioned, from time to time. The above graph is used to explain the concept and is for illustration purpose only and should not used for development or implementation of an investment strategy. NSE Disclaimer: It is to be distinctly understood that the permission given by NSE should not in any way be deemed or construed that the Scheme Information Document has been cleared or approved by NSE nor does it certify the correctness or completeness of any of the contents of the Draft Scheme Information Document. The investors are advised to refer to the Scheme Information Document for the full text of the 'Disclaimer Clause of NSE. The Axis Nifty IT Index Fund offered by “the issuer” is not sponsored, endorsed, sold or promoted by NSE Indices Limited (formerly known as India Index Services & Products Limited (IISL)). NSE Indices Limited does not make any representation or warranty, express or implied (including warranties of merchantability or fitness for particular purpose or use) and disclaims all liability to the owners of Axis Nifty IT Index Fund or any member of the public regarding the advisability of investing in securities generally or in the Axis Nifty IT Index Fund linked to Nifty IT Index TRI or particularly in the ability of the Nifty IT Index TRI to track general stock market performance in India. Please read the full Disclaimers in relation to the Nifty IT Index TRI in the in the Offer Document / Prospectus / Scheme Information Document. The fund manager(s) may or may not choose to hold the stock mentioned, from time to time. Investors are requested to consult their financial, tax and other advisors before taking any investment decision(s). Statutory Details: Axis Mutual Fund has been established as a Trust under the Indian Trusts Act, 1882, sponsored by Axis Bank Ltd. (liability restricted to Rs. 1 Lakh). Trustee: Axis Mutual Fund Trustee Ltd. Investment Manager: Axis Asset Management Co. Ltd. (the AMC). Risk Factors: Axis Bank responsible for any loss or shortfall resulting from the operation of the scheme. This document represents the views of Axis Asset Management Co. Ltd. and must not be taken as the basis for an investment decision. Neither Axis Mutual Fund, Axis Mutual Fund Trustee Limited nor Axis Asset Management Company Limited, its Directors or associates shall be liable for any damages including lost revenue or lost profits that may arise from the use of the information contained herein. No representation or warranty is made as to the accuracy, completeness or fairness of the information and opinions contained herein. The AMC reserves the right to make modifications and alterations to this statement as may be required from time to time. Limited is not liable or Mutual Fund Investments are subject to market risks, read all scheme related documents carefully. 28
Thank You 29