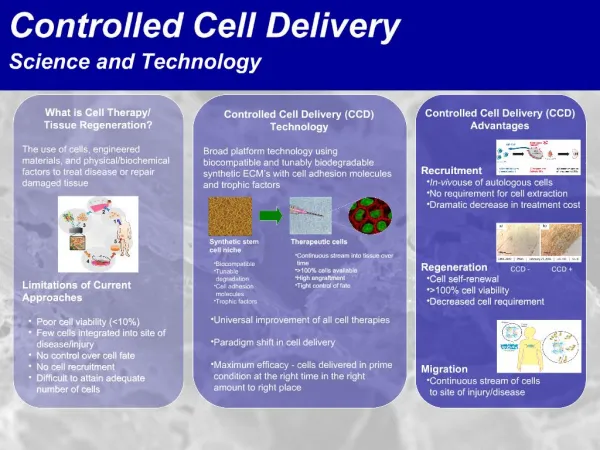
science and technology evolution
The evolution of science and technology traces the journey from humanityu2019s early quest for understanding to today's digital era, marked by remarkable innovation and exploration. The journey began with ancient civilizations, where the foundations of mathematics, astronomy, and medicine were laid. With the Renaissance, a wave of scientific inquiry and discovery flourished, as thinkers like Galileo, Newton, and Da Vinci questioned traditional beliefs, applying observation and experimentation.


science and technology evolution
E N D
Presentation Transcript
Journal of Science and Technology ISSN: 2456-5660 Volume 8, Issue 05 (May -2023) www.jst.org.in DOI:https://doi.org/10.46243/jst.2023.v8.i05.pp49 - 56 Bi-Modal Oil Temperature Forecasting in Electrical Transformers using a Hybrid of Transformer, CNN and Bi-LSTM Varun Gupta , Ankit Yadav, Dinesh Kumar Vishwakarma, Narendra Kumar 1Department of Electrical Engineering Delhi Technological University Delhi, India 2Vaibhav Srivastava Department of Electrical Engineering Delhi Technological University Delhi, India 3Vishu Tomar Department of Electrical Engineering Delhi Technological University Delhi, India gvarun071@gmail.com, ankit4607@gmail.com vaibhavsrivastava2107@gmail.com dvishwakarma@gmail.com vishu03tomar@gmail.com , narendrakumar@dtu.ac.in To Cite this Article Varun Gupta , Ankit Yadav, Dinesh Kumar Vishwakarma, Narendra Kumar , Bi-Modal Oil Temperature Forecasting in Electrical Transformers using a Hybrid of Transformer, CNN and Bi-LSTM” Journal of Science and Technology, Vol. 08, Issue 05,-May 2023, pp49-56 Article Info Received: 27-04-2023 Revised: 10-05-2023 Accepted: 22-05-2023 Published: 30-05-2023 Abstract- Power consumption prediction is a tough task because of its fluctuating nature. If the expected demand is excessively high in comparison to the existing demand, the transformer may damage. Predicting the temperature of transformer oil is an efficient approach to verify the transformer's safety status. As a result, in this study, we offer a bimodal architecture for predicting oil temperature given a sequence of prior temperatures. Our model was tested using the Ettm1, Ettm2, and Etth1 datasets and achieved an RMSE of 0.41375, MAE of 0.3031 and MAPE of 8.292% on Ettm1 test dataset, an RMSE of 0.4105, MAE 0.3090 and MAPE of 6.678% on Ettm2 test dataset and an RMSE of 0.6762, MAE 0.4690 and MAPE of 11.23% on Etth1 test dataset. Keywords – transformers, vision transformers, positional encoding, Multi-head attention, forecasting 1 Introduction The electric power distribution problem is the distribution of electricity to different areas depending on its sequential usage. However, it may be challenging to predict future demand for a specific location because it fluctuates according to days of the week, seasons, weather, and temperatures, etc. However, no system now in use can provide an accurate long-term forecast using extremely long-term real-world data. Any erroneous prophecy has the potential to harm the transformer's electrical components. Managers must decide based on the empirical estimate, which is far higher than the demands in reality, as there is no reliable way to anticipate future power use. If the prediction is not accurate, the entire transformer can be damaged. On the other hand, a transformer's electrical status may be determined by the transformer’s oil temperature. So it’s an efficient strategy to predict how the transformer’s oil temperature is safe and it can help us avoid unnecessary waste. Initially, statistical techniques like ARIMA [1] , [2], SARIMA, ARIMAX etc, and traditional machine learning techniques like GBRT, and SVR [3] were used for TSF. Because of their inability to capture long-range dependencies within a time series, their performance was not up to the mark. Deep learning-based approaches like RNN, LSTM [4], and GRU have been proposed for TSF and have shown promising results. A sophisticated deep neural network is required for the extraction of temporal connections since we are working with time series www.jst.org.in Published by: Longman Publishers Page | 49
Journal of Science and Technology ISSN: 2456-5660 Volume 8, Issue 05 (May -2023) www.jst.org.in DOI:https://doi.org/10.46243/jst.2023.v8.i05.pp49 - 56 data that is growing more complex and diverse, ranging from univariate to multivariate to today's big-time series. The Transformer architecture [5] not only captures the long-range dependencies but also, its self-attention mechanism permits it to concentrate on the sequence segment that is most crucial for prediction. Since its introduction, the transformer has been applied to a majority of tasks ranging from NLP, speech recognition and human-motion recognition. Since then, there has been a surge of Transformer based models for TSF. The major contributions of this manuscript are: 1.Proposed a bimodal architecture consisting of two branches, one being the sequence transformer and the other being the LSTM-CNN branch. 2.The proposed model has achieved an RMSE of 0.41375, MAE 0.3031 and MAPE of 8.292% on Ettm1 test dataset, an RMSE of 0.4105, MAE 0.3090 and MAPE of 6.678% on Ettm2 test dataset and an RMSE of 0.6762, MAE 0.4690 and MAPE of 11.23% on Etth1 test dataset. 2 Related Work Theoretical guarantees exist for conventional time series forecasting techniques like ARIMA model [1] and Holt-Winters seasonal approach [6]. They only really apply to univariate forecasting issues, which limits their use to complicated time series data. Deep learning-based TSF algorithms have the potential to produce more accurate forecasts than traditional methods due to the recent increases in processing power and data availability [7] [8]. As seen in Fig. 1, earlier RNN-based TSF algorithms [9] [10] condense the previous data into internal memory states that are iteratively updated with fresh inputs at every time step. The implementation of RNN- based models is severely constrained by the gradient vanishing/exploding difficulties [11] and the ineffective training process [12]. Outpu ts Recurrent Inputs Fig. 1 RNN Model Due to the efficacy and robustness of the self-attention processes, Transformer-based models [5] have recently replaced RNN models in practically all sequence modeling applications. In the literature, many Transformer-based TSF approaches (see Fig. 2 ) have been proposed [13], [7], [14], [15], [16], [17], [18], [19]. Utilizing their impressive long sequence modeling skills, these works frequently concentrate on the difficult long-term time series forecasting challenge Output Attention Layer Projection Layer Inputs Fig. 2 Transformer Model www.jst.org.in Published by: Longman Publishers Page | 50
Journal of Science and Technology ISSN: 2456-5660 Volume 8, Issue 05 (May -2023) www.jst.org.in DOI:https://doi.org/10.46243/jst.2023.v8.i05.pp49 - 56 3 Proposed Model In this section, the proposed model is explained in detail. Input Sequence Input Embedding Token Embedding Positional Embedding Encoder Bi-LSTM Image Formation Block Encoder CNN Block X3 Feature Merging Linear Input Layer/Embedding Fig. 3 The overall architecture of the proposed model. 3.1 Sequence Transformer Block Vanilla Transformers [5] outperform other sequence-based models like LSTM [11], encoder-decoder models [17], RNN, etc. in time series tasks and natural language processing. The secret to their greater performance is a self-attention mechanism that enables a transformer to concentrate more on a sequence of inputs that is more crucial for prediction. Several identical blocks make up both the encoder and decoder. Each encoder block is made up of a position-wise feed-forward network and a multi-head self-attention module.. Positional encoding is used to feed the transformer encoder with positional information about the input sequence. Fig. 4 shows the architecture of the sequence transformer block. www.jst.org.in Published by: Longman Publishers Page | 51
Journal of Science and Technology ISSN: 2456-5660 Volume 8, Issue 05 (May -2023) www.jst.org.in DOI:https://doi.org/10.46243/jst.2023.v8.i05.pp49 - 56 LayerNorm MHSA LayerNorm Feed Forward Output of Encoder Fig. 4 The Sequence Encoder Block 3.1.1 Positional Encoding Positional encoding is a tool to denote the location of an entity within a sequence so that each location gets a unique representation. A transformer has no recurrence. The transformer fixes this by including a positional encoding vector in each input embedding. The model learns a pattern from these vectors that allows it to estimate the position of each component or the separation between them in the input sequence 3.1.2 Multi Head Attention An attention mechanism uses many heads to process attention concurrently. The individual attention outputs are then linearly combined to obtain the expected dimension. Multiple attention heads enable for diverse attention to be paid to different sequence elements. ( ) [ ] (1) ) Where ( Here are learnable parameters learned during backpropagation. 3.1.3 Feed Forward Network and Residual Connection: The purpose of this simple feed-forward neural network, which is applied to each attention vector, is to convert the attention vectors into a format that the following encoder or decoder layer can interpret. Each sub- layer in an transformer-encoder has a residual connection all around it, and a layer-normalization layer comes after it. 3.2 Bi-LSTM layer The sequence is passed through a Bi-LSTM layer that captures the sequence information bi-directionally. A Bi-LSTM effectively consists of 2 LSTM models, one taking sequence in the forward direction and the second taking sequence in the backward direction. www.jst.org.in Published by: Longman Publishers Page | 52
Journal of Science and Technology ISSN: 2456-5660 Volume 8, Issue 05 (May -2023) www.jst.org.in DOI:https://doi.org/10.46243/jst.2023.v8.i05.pp49 - 56 3.3 Image Creation Block The information/feature map coming out of a transformer block was passed through an activation layer and then projected to form a 3-D feature map of dimension containing sequence information. from a feature map of the dimension 3.4 CNN Block The CNN block consists of 3 stages. The architectural design of both stages is the same. For an input feature map of shape where are the feature map’s resolutions and denotes the number of channels feature map, first feature map is passed through a downsampling layer which reduces the resolutions by a factor of 2 and increases the depth by a factor of 2 times to form a feature-map of shape groupwise convolution layer with kernel size and LayerNorm. This feature map is then passed through a convolution layer with output channels. This is followed by the GELU activation layer and another convolution layer is applied with number of kernels. , followed by a 4 4.1 Experimental Setup Datasets The Electricity Transformer Temperature dataset [20] gathers electrical data for two years (July 2016 to July 2018) from two transformers in China, including oil temperature and load data that is collected every 15 or every hour. The datasets have been divided into train , validation and test set in the ratio 8:1:1 respectively. 4.2 Data Pre-processing The dataset was standardized using MinMaxScaler to scale all the input features in the range [-1,1]. 4.3 Hardware The models were trained on NVIDIA TITAN RTX GPU (24GB VRAM) 4.4 Hyperparameters AdamW was used for training the model with an initial learning rate of 3e-4 and the StepLR learning rate scheduler was used. The model was trained for 100 epochs with a batch size of 64 and an input window size of 192 and output horizon of 1. The models were trained with Pytorch on NVIDIA TITAN RTX GPU. 4.5 The forecast obtained was evaluated on 3 parameters namely MAE, RMSE and MAPE. RMSE: It is the square root of the average of the square of residuals between the ground-truth value and predicted value. Intrinsically it informs you of the strength of the data surrounding the line of best fit. Mathematically RMSE is Calculated as: Performance Metrics √ MAE: It is defined as the average of the absolute difference between the ground-truth value of a quantity and the predicted value of that quantity. Mathematically MAE is calculated as: ∑ | | MAPE: The Mean Absolute Percent Error (MAPE) is used to gauge the accuracy of the forecast. It is commonly known as Mean Absolute Percent Deviation (MAPD). The accuracy is expressed as a percentage. It can be enumerated by multiplying the average percent inaccuracy each time by the absolute value minus the absolute value. Mathematically MAPE is Calculated as: ∑ | (2) ∑ ( ) (3) (4) | 5 Results and Discussion This section illustrates the proposed model's results on benchmark datasets. www.jst.org.in Published by: Longman Publishers Page | 53
Journal of Science and Technology ISSN: 2456-5660 Volume 8, Issue 05 (May -2023) www.jst.org.in DOI:https://doi.org/10.46243/jst.2023.v8.i05.pp49 - 56 5.1 Quantitative Analysis The proposed model has been evaluated on Ettm1, Ettm2 and Etth1 datasets with the target variable being Oil Temperature and the results have been tabulated in Table 1. Table 1 Prediction Results proposed model w.r.t Oil Temperature on Ettm1, Ettm2 and Etth1 dataset Dataset Metric Score MAE ( 0.3031 RMSE ( 0.4137 MAPE (%) 8.2920 MAE ( 0.3090 RMSE ( 0.4105 MAPE (%) 6.6780 MAE ( 0.4690 RMSE ( 0.6762 MAPE (%) 11.2300 ) ) Ettm1 ) ) Ettm2 ) ) Etth1 5.2 Qualitative Analysis Fig. 5demonstrates the plot of the ground truth series and series as predicted by the proposed model. It can be observed that the output time-series is very similar to the original time series and thus the proposed model can learn the inherent information present within the time series. The errors are also very close to zero as depicted by the green series. Fig. 5 Time Series Plots of Ground Truth Time Series and Time Series predicted by the proposed model on the Ettm2 test set. 6 Conclusion and Future Trends In this paper, we have proposed a bimodal architecture for oil temperature prediction of electrical transformers and have conducted extensive experiments on Etth1, Etth2 and Ettm1 datasets. The proposed model has achieved an RMSE of 0.41375, MAE 0.3031 and MAPE of 8.292% on Ettm1 test dataset, an RMSE of 0.4105, MAE 0.3090 and MAPE of 6.678% on Ettm2 test dataset and an RMSE of 0.6762, MAE 0.4690 and MAPE of 11.23% on Etth1 test dataset. 7 References [1] G. E. Box and M. G. Jenkins, “Some Recent Advances in Forecasting and Control,” Journal of the Royal Statistical Society Series C: Applied Statistics, vol. 23, no. 2, pp. 158-179, 1974. [2] P. Chujai and N. Kerdprasop, “Time Series Analysis of Household Electrical Consumption with ARIMA and ARMA Models,” in International MultiConference of Engineers and Computer Scientists 2013 Vol I, Hong Kong, 2013. [3] H. Drucker, L. Kaufman, A. Smola and V. Vapnik, “Support vector regression machines,” in NIPS, 1996. www.jst.org.in Published by: Longman Publishers Page | 54
Journal of Science and Technology ISSN: 2456-5660 Volume 8, Issue 05 (May -2023) www.jst.org.in DOI:https://doi.org/10.46243/jst.2023.v8.i05.pp49 - 56 [4] S. Hochreiter and J. Schmidhuber, “Long Short-Term Memory,” Neural Computation, vol. 9, pp. 1735-1780, 1997. [5] A. Vaswani and N. Shazeer, “Attention Is All You Need,” in Neural Information Processing Systems, Long Beach, 2017. [6] C. C. Holt, “Forecasting seasonals and trends by exponentially weighted moving averages,” International Journal of Forecasting, vol. 20, pp. 5-10, 2004. [7] B. Lim, N. Loeff and T. Pfister, “Temporal Fusion Transformers for interpretable multi-horizon time series forecasting,” International Journal of Forecasting, vol. 37, pp. 1748-1764, 2021. [8] B. Oreshkin, D. Carpo, N. Chapados and Y. Bengio, “N-beats: Neural basis expansion analysis,” in ICLR, 2021. [9] S. S. Rangapuram, M. W. Seeger and J. Gasthaus, “Deep state space models for time series forecasting,” in NIPS, 2021. [10] D. Salinas, V. Flunkert, J. Gasthaus and T. Januschowski, “DeepAR: Probabilistic forecasting with autoregressive recurrent networks,” International Journal of Forecasting, vol. 36, pp. 1181-1191, 2020. [11] Y. Benjio, “Learning long-term dependencies with gradient descent is difficult,” IEEE Transactions on Neural Networks, vol. 5, no. 2, pp. 157-166, 1994. [12] Gers, S. and F. A., “Applying LSTM to time series predictable through time-window approaches,” in Springer, 2001. [13] S. Li, X. Jin, Y. Xuan and X. Zhou, “Enhancing the locality and breaking the memory bottleneck of transformer on time series forecasting,” in NIPS, 2019. [14] N. Wu and B. Green, “Deep Transformer Models For Time Series Forecasting: The Influenza Prevalence Case,” arXiv, p. 10, 2020. [15] K. Kondo and M. Kimura, “Sequence to sequence with attention for influenza prevalence prediction using google trends,” in Proceedings of the 2019 3rd International Conference on Computational Biology and Bioinformatics, New York, 2019. [16] L. S. SAOUD and H. AlMarzouqi, “Cascaded Deep Hybrid Models For Multistep Household Energy Consumption Forecasting,” arXiv, p. 13, 13 10 2022. [17] Sutskever and O. Vinyals, “Sequence to Sequence Learning with Neural Networks,” arXiv, 2014. [18] H. Wu, J. Xu and J. Wang, “. Autoformer: Decomposition transformers with autocorrelation for long-term series forecasting,” in NIPS, 2021. [19] S. Liu, H. Yu, C. Liao and J. Li, “Pyraformer: Lowcomplexity pyramidal attention for long-range time series modeling and forecasting,” in ICLR, 2021. [20] H. Zhou, S. Zhang and J. Peng, “Informer: Beyond Efficient Transformer for Long Sequence Time-Series Forecasting,” in AAAI, 2021. www.jst.org.in Published by: Longman Publishers Page | 55
Journal of Science and Technology ISSN: 2456-5660 Volume 8, Issue 05 (May -2023) www.jst.org.in DOI:https://doi.org/10.46243/jst.2023.v8.i05.pp49 - 56 www.jst.org.in Published by: Longman Publishers Page | 56