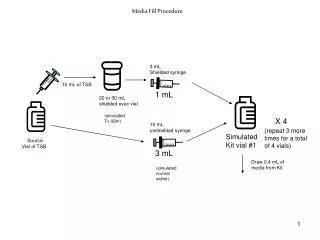
permanent tsb House Price Index 10 Year Review
permanent tsb House Price Index 10 Year Review Key findings National annual price growth averaged 14.9% over the last 10 years. Ten year growth rate nationally 270%. 1998 had highest annual price growth (30.0%) & 2001 had lowest (4.5%).


permanent tsb House Price Index 10 Year Review
E N D
Presentation Transcript
Key findings • National annual price growth averaged 14.9% over the last 10 years. • Ten year growth rate nationally 270%. • 1998 had highest annual price growth (30.0%) & 2001 had lowest (4.5%). • National house price grew from €75k to €280k between 1996 & 2005. • Price gap between Dublin and Outside Dublin increased from €10k to €130k between 1996 and 2005.
Key findings continued • Key drivers of past price growth - favourable economic & interest rate environment; increasing population. • External shocks have impacted on general growth trends. • 1/3 of current housing stock (547,000) was built in last 10 years. • Value of the Housing Stock has grown 4 fold to €412bn in last 10 years (Source ESRI).
Agenda • Market changes and drivers • Price trends • Property ownership patterns
Market changes and drivers
Average annual growth 14.9%over the last 10 years. 30.0% €150k €290k €100k €250k €85k €200k 2.4%
A number of Government tax/grant changes have introduced in the last 10 years.
A number of Government tax/grant changes have been introduced in the last 10 years. Bacon 2 Bacon 1 Bacon 3
Fertile economic and interest rate environment has significantly helped the market thrive. GNP averaged 6.5%p.a. 1996 - 2005 Loan rate 3.75% Loan rate 7.5%
External shocks seem to have influenced house price growth over the last 10 years. Economist & IMF warnings IMF warning
Price gap between Dublin and Outside Dublin has widened to almost €130k in last 10 years December prices
Urbanisation/ commuting/ demand for second homes key drivers of regional differences. €’000s 6 month average prices
Top 5 and bottom 5 areas by 10 year growth rates. Note : Dublin prices are end of year levels, while other prices are yearly average.
House prices for a first-time buyer and non-FTB now diverge by over €60,000. December prices
Prices for New and Existing properties have grown by more than three fold, while price gap has remained unchanged in last 10 years December prices
Majority of properties now priced over €250k compared to 1996 when most were less than €100k.
Property ownership patterns
Property size shows no change in Dublin, increasing in the rest of Ireland. Size in sq. ft.
Significant rise in the percentage of apartments within DUBLIN properties since 1996. Dublin
Commuter counties (Meath; Wicklow; Kildare; Louth) profile moving towards Dublin. Commuter counties
Almost 75%of properties OUTSIDE DUBLIN are detached or semi-detached; apartment percentage unchanged since 1996. Outside Dublin
Summary & Conclusions • National annual house price growth averaged almost 15% ‘96 - ‘05. • National price increased from €75k in 1996 to €280k at end of 2005. • GNP averaging 6.5% and interest rates down to half pre EMU levels key market drivers. • Affordability broadly stable since 1998. • Dublin and Outside Dublin price difference grown from €10k to €130k • Significant variation in ten year price growth across counties. • 55% of properties priced over €250k in 2005 - just 1% in 1996. • 50% increase in no. of apts within Dublin properties over 10 yrs. • Properties Outside Dublin getting larger while Dublin ones unchanged
County price differentials have widened significantly, especially in the last five years. Note : Dublin prices are end of year levels, while other prices are yearly average.
Housing completions continue to set new records Source: Department of the Environment (DOE)
Population - almost 50%(1.8m) of the pop. aged < 30. Net inward migration accounted for almost half of 65,000 total pop. growth to April 2004 (Source CSO).
REGIONAL LISTING • BORDER - Cavan; Donegal; Leitrim; Louth; Monaghan; Sligo. • MIDEAST - Kildare; Meath; Wicklow. • MIDLANDS - Laois; Longford; Offaly; Westmeath. • MIDWEST - Clare; Limerick; Tipperary North. • SOUTH EAST - Carlow; Kilkenny; Wexford; Waterford; Tipperary South. • SOUTH WEST - Cork; Kerry. • WEST - Galway; Mayo; Roscommon.