Download
1 / 49
530 likes | 776 Views
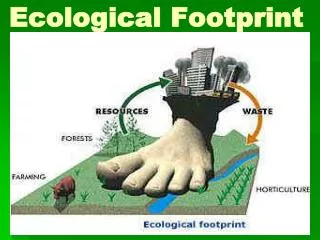
OUR Ecological Footprint - 11 1. 11. The hierarchical nature and processes of different levels of ecological systems :. Individual organism : How do structure, physiology, and behavior lead to the individual’s survival and reproduction?

E N D
The hierarchical nature and processes of different levels of ecological systems:
Individual organism: How do structure, physiology, and behavior lead to the individual’s survival and reproduction? • Population: What determines the number of individuals and their variation in time and space? • Community: What determines the diversity and relative abundance of organisms living together? • Ecosystem: How does energy flow and mattercycle in the biotic and abiotic environment? • Biosphere: How do air, water, and the energy and chemicals they contain circulate globally?
Ecosystem Ecology:Interactions between abiotic and biotic factors at a given location as relates to: energy flow and cycling of matter. IB 452: Ecosystem Ecology fall 2009 IB 440: Plants and Global Change spring 2009
Energy flow in ecosystemsObjectives: The ecosystem obeys thermodynamic principles. • Trophic pyramids for energy, biomass, numbers • Primary production: efficiencies and factors causing variation among biomes • Secondary production: • Intertrophic transfers: efficiencies and food chain length Intratrophic transfers: efficiencies
Ecosystem: an energy-transforming machine • Exchanges of matter and energy among components • Obey thermodynamic principles that govern energy transformations • Law 1: Conservation of energy • “balance the books” • Law 2: Inefficient transformation of energy • “heat tax”
Coupling of oxidations and reductions = basis of energy flow in ecosystems.
Energy flows through biochemical pathways.Energy transfer decreases after each transformation.
Heat is lost as energy flows through food chain. Matter recycles… Blue = matter Red = energy
PrimaryProduction: • by plants • process of converting light energy to chemical bond energy in carbohydrates (via photosynthesis!) • for each g of C assimilated, 39 KJ energy stored • rate determines rate of energy supply to rest of ecosystem
GrossPP = NetPP + Respiration Day + night Day Figure 1
IRGA - Infrared gas analzyer:measure CO2 in vs. out: in sunlight (NPP) and dark (respiration); estimate GPP
Indirect measures of GPP Figure 2
*** Measurements of PP by IRGA Full sun: CO2 depleted from chamber at rate of 12 mg CO2 per 100 cm2 leaf area per hour Dark: CO2 released by leaf into chamber at rate of 1.5 mg CO2 per 100 cm2 leaf area per hour What is the rate of NPP for this leaf? Explain. What is the rate of respiration for this leaf? Explain. What is the rate of GPP for this leaf? Explain. Figure 3
Limits on Productivity • Photosynthetic efficiency • (% energy from sun converted to NPP) = 1-2% • Net production efficiency (NPP/GPP) 30% tropics 75-80% temperate ***why difference? • Light • Temperature • Precipitation • Nutrients • CO2
Photosynthesis and light…PS efficiency = % sun’s energy into NPP Figure 4
NPP vs. Temperature and Precipitation Water use efficiency = G NPP per kg water transpired Figure 5
NPP vs. nitrogen (N in rubisco in PS) Nutrient use efficiency = g production per g N assimilated Figure 6
Productivity and nutrients Figure 8
NPP + > [CO2] To what extent is PS limited by amount of CO2? To what extent does vegetation act as a C sink?
Hypothesis: Sp richness and functional diversity increase NPP (via more biomass). Figure 9
Results Figure 10
1° productivity of aquatic ecosystems depends on [nutrients]. • Freshwater lakes: • P often limiting; • with low N/P, blue-green algae increase NPP because they can fix additional N; • with high N/P, green algal ‘blooms’ occur • Open ocean: • near shore: N often limiting • open ocean: silica and Fe more limiting
PP in aquatic ecosystems - highest where nutrients regenerated in sediments reach light zone. Figure 11
Question: Is NPP in the open ocean limited by nutrients (e.g Fe)? Hypothesis: NPP in the open ocean is limited by availability of iron. Experimental setup? Prediction: Amount of chlorophyll a increases both at surface and 30 m deep in area with added Fe relative to area without Fe. Figure 12
What is the conclusion? Figure 12
Global variation in estimatedNPP Figure 13
NPP varies among habitats: Figure 14
Energy flows through: Food chain – energy passes through many steps or links Trophic level (feeding level) = each link in food chain Two parallel food chains Plant-based Decomposer-based
Food chains represent energy relationships. Consumers (heterotrophs) Producers (autotrophs) Figure 15
Energy Pyramid: 10% law of energy transfer;2nd law limits number of levels. 90% lost at each level .1 1 10 100 Figure 16
Energy transfer between trophic levelsdepends on: • NPP • efficiencies of transfer between trophic levels • residence time longer time--> > accumulation of energy
Food energy available to the human population depends on their trophic level. Figure 17
***Pyramids:Which can be inverted? Why? Energy Numbers Biomass Figure 18
Ecological (food chain) efficiency =net production of trophic level_n net production of trophic level n-1 10 15 20 1 sun Figure 19
Ecological (food chain ) efficiency • Production of each trophic level = 5 – 20% that of level below it • Replaces the “10% law”= an average; not fixed • Often lower on land (5-15%) than aquatic (15-20%)
Energy (kcal m-2 yr-1) Energy production Primary Primary Secondary __or removal_____ Producers Consumers Consumers Non-consumed production 704 70 13 Removed by consumers 176 34 0 Respiration 234 44 18 Gross production (totals) 1114____ 148 ____ 31____ 1) Calculate NPP. _____ 2) Calculate Ecological Efficiency during 2 transfers (= food chain efficiency). ______ ______ 3) What ultimately happens to 1) the energy and 2) the biomass that is not consumed in this lake? Figure 20
What limits length of food chain? • H1: Energetics • Availability of energy limits to 5-7 levels • Depends on: NPP energy needed by consumers average ecological efficiency • H2: Dynamic stability Longer chains less stable because: Fluctuations at lower trophic levels magnified at higher levels ---> extinction of top predators.
***Do aquatic or terrestrial ecosystems have more trophic levels? What factor contributes most to variation in food chain length among these ecosystems?Community NPP Consumer Ecological # Trophic Ingestion Efficiency% LevelsOpen ocean 500 0.1 25 7.1Coastal marine 8000 10.0 20 5.1Grassland 2000 1.0 10 4.3Tropical forest 8000 10.0 5 3.2 Figure 22
Secondaryproduction • By non-photosynthesizers • Amount of chemical energy in consumer’s food converted to biomass /unit time
Energy flow within a trophic level Secondary production = assimilated energy – respiration – excretion Figure 23
Some general rules • Assimilation efficiency increases at higher trophic levels. • Net and gross production efficiencies decrease at higher trophic level. • Ecological efficiency averages about 10%. • About 1% of NPP ends up as production on third trophic level; • The pyramid of energy narrows quickly.
Net Ecosystem Production (NEP) = carbon gain - carbon lost Measures net carbon accumulation --> carbon ‘sequestered’ in organic cmpds in soil and living biomass --> no ‘greenhouse’ warming effect Positive NEP represents carbon sink --> removes CO2 from atmosphere