Download
1 / 4
40 likes | 158 Views
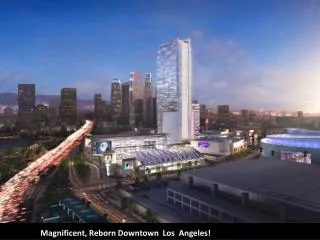
LoftWay assures that you see all the LOFTS in the area that meet your criteria. Not just those listed on the local MLS. To know more about Downtown Los Angeles Lofts visit website today!

E N D
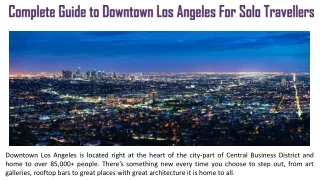
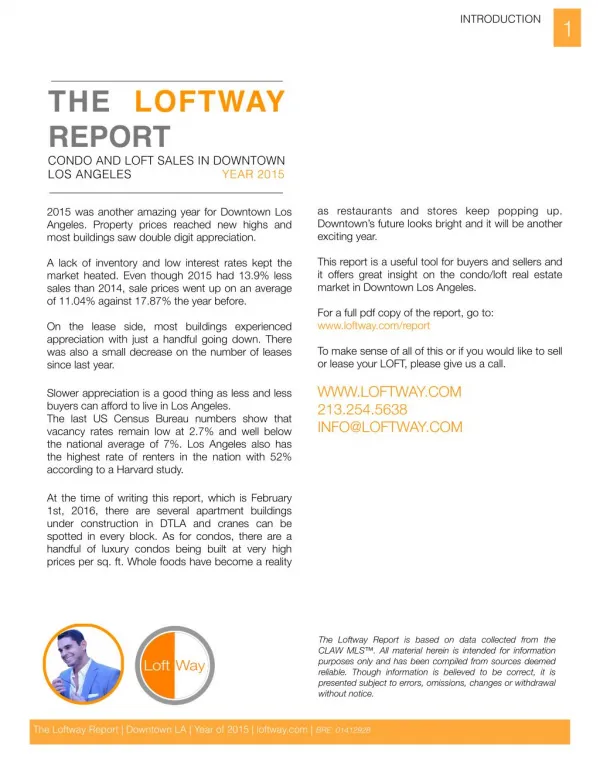
INTRODUCTION 1 THE LOFTWAY REPORT CONDO AND LOFT SALES IN DOWNTOWN LOS ANGELES YEAR 2015 as restaurants and stores keep popping up. Downtown’s future looks bright and it will be another exciting year. 2015 was another amazing year for Downtown Los Angeles. Property prices reached new highs and most buildings saw double digit appreciation. This report is a useful tool for buyers and sellers and it offers great insight on the condo/loft real estate market in Downtown Los Angeles. A lack of inventory and low interest rates kept the market heated. Even though 2015 had 13.9% less sales than 2014, sale prices went up on an average of 11.04% against 17.87% the year before. For a full pdf copy of the report, go to: www.loftway.com/report On the lease side, most buildings experienced appreciation with just a handful going down. There was also a small decrease on the number of leases since last year. To make sense of all of this or if you would like to sell or lease your LOFT, please give us a call. WWW.LOFTWAY.COM 213.254.5638 INFO@LOFTWAY.COM Slower appreciation is a good thing as less and less buyers can afford to live in Los Angeles. The last US Census Bureau numbers show that vacancy rates remain low at 2.7% and well below the national average of 7%. Los Angeles also has the highest rate of renters in the nation with 52% according to a Harvard study. At the time of writing this report, which is February 1st, 2016, there are several apartment buildings under construction in DTLA and cranes can be spotted in every block. As for condos, there are a handful of luxury condos being built at very high prices per sq. ft. Whole foods have become a reality The Loftway Report is based on data collected from the CLAW MLS™. All material herein is intended for information purposes only and has been compiled from sources deemed reliable. Though information is believed to be correct, it is presented subject to errors, omissions, changes or withdrawal without notice. The Loftway Report | Downtown LA | Year of 2015 | loftway.com | BRE: 01412928
INFOGRAPHIC 2 LOFT AND CONDO SALES 2015 34 NUMBER OF BUILDINGS IN THE REPORT 324 NUMBER OF SALES $601.39 AVERAGE PRICE PER SQ FT 62 AVERAGE DOM TOP 5 BUILDINGS BY PRICE PER SQ FT $1,078.27 356 $759.11 NUMBER OF LEASES IN 2015 $722.80 $713.97 $688.90 MOST LEAST EXPENSIVE* EXPENSIVE* *BUILDING FOR LEASE BY PRICE PER SQ FT: RITZ LUMA SOUTH BISCUIT CO ROWAN BUILDING EVO SOUTH RESIDENCES BOTTOM 5 BUILDINGS BY PRICE PER SQ FT $376.65 $420.06 RITZ TOY $449.09 RESIDENCES WAREHOUSE $483.53 $487.00 BUILDING WITH HIGHEST PERCENTAGE INCREASE FOR SALE FROM LAST YEAR: 35.18% ALTA LOFTS FLOWER LOFTS LITTLE TOKYO LOFTS SB SANTEE ECKARDT 25.25% 20.68% GRAND HIGHEST SALE OF THE YEAR: EVO $3,450,000 LOWEST SALE OF THE YEAR: LITTLE TOKYO LOFTS $270,000 $ MOLINO LOFTS BISCUIT LOFTS GRAND LOFTS The Loftway Report | Downtown LA | Year of 2015 | loftway.com | BRE: 01412928
SALES 3 CHANGE FROM LAST YEAR 9.79% NUMBER OF SALES 22 PRICE P/SQ FT 2014 $615.29 PRICE P/ SQ FT 2015 $675.54 DOM 96 BUILDINGS 1100 Wilshire 655 Hope 7 48 $558.97 $654.04 17.01% 940 E 2nd 3 16 $596.69 $645.03 8.10% Alta Lofts 6 44 $344.36 $376.65 9.38% Barker Block 16 49 $565.47 $616.23 8.98% Bartlett 9 86 $530.49 $584.48 10.18% Beacon 1 13 $511.26 $573.68 12.21% Biscuit Lofts 8 32 $577.07 $722.80 25.25% Concerto 8 44 $577.30 $623.43 7.99% Douglas Building 3 100 $583.62 $686.94 17.70% Eastern Columbia 9 49 $525.91 $632.33 20.24% Eldorado Lofts 8 52 $548.37 $595.88 8.66% Elleven South 17 62 $565.36 $592.20 4.75% EVO South 28 69 $631.61 $688.90 9.07% Flower Lofts 5 84 $569.66 $420.06 26.26% Gallery Lofts 1 11 - $628.27 - Grand Lofts 5 39 $423.08 $510.56 20.68% Higgins Lofts 6 53 $503.38 $597.23 18.64% Library Court 5 157 $524.81 $579.22 10.37% Little Tokyo Lofts 19 77 $381.88 $449.09 17.60% Luma South 24 82 $677.21 $759.11 12.09% Market Lofts 19 80 $561.32 $596.89 6.34% Molino Lofts 8 66 $366.49 $495.42 35.18% Pan American Lofts 3 53 $550.00 $536.43 2.47% Ritz Residences 13 70 $989.78 $1078.27 8.94% Rowan Lofts 18 40 $615.34 $713.97 16.03% Santee Cornell 5 63 $502.93 $544.66 8.30% Santee Eckard 5 52 $435.04 $487.00 11.94% Santee Textille 5 56 $529.57 $598.75 13.06% SB Grand 12 68 $435.41 $483.53 11.05% SKY Lofts 13 90 $597.22 $615.98 3.14% The Tomahawk - - - - - Toy Factory 11 21 $516.98 $594.18 14.93% Toy Warehouse 2 61 $419.89 $488.97 16.45% Totals & Averages 324 60 $541.62 $601.39 11.04% The Loftway Report | Downtown LA | Year of 2015 | loftway.com | BRE: 01412928
LEASES 4 NUMBER OF LEASES 31 PRICE P/SQ FT 2014 $3.14 PRICE P/ SQ FT 2015 $3.19 CHANGE FROM LAST YEAR 1.59% DOM 27 BUILDINGS 1100 Wilshire 655 Hope 7 44 $2.81 $3.13 11.39% 940 E 2nd 4 38 $2.67 $2.88 7.87% Alta Lofts 2 21 $1.56 $1.95 25.00% Barker Block 33 24 $2.54 $2.63 3.54% Bartlett 8 33 $2.26 $2.69 19.03% Beacon 1 13 $2.33 $2.69 15.45% Biscuit Lofts 8 27 $2.62 $3.10 18.32% Concerto 12 26 $2.53 $2.72 7.51% Douglas Building 1 18 $3.26 $3.20 1.84% Eastern Columbia 15 30 $2.36 $2.55 8.05% Eldorado Lofts 2 8 $2.36 $2.95 25.00% Elleven South 25 38 $2.46 $2.44 0.81% EVO South 19 46 $2.70 $2.76 2.22% Flower Lofts 8 45 $2.05 $2.20 7.32% Gallery Lofts - - $2.20 - - Grand Lofts 15 34 $2.27 $2.31 1.76% Higgins Lofts 17 33 $2.52 $2.58 2.38% Library Court 9 27 $2.53 $3.03 19.76% Little Tokyo Lofts 4 20 $1.96 $2.53 29.08% Luma South 30 37 $2.84 $2.92 2.82% Market Lofts 28 43 $2.61 $2.80 7.28% Molino Lofts 4 16 $1.71 $1.99 16.37% Pan American Lofts 3 117 $2.47 $2.52 2.02% Ritz Residences 30 77 $4.15 $4.32 4.10% Rowan Lofts 11 23 $2.74 $3.18 16.06% Santee Cornell 3 16 $2.25 $2.55 13.33% Santee Eckard 3 34 $2.18 $2.35 7.80% Santee Textille 1 4 $2.36 $2.38 0.85% SB Grand 5 50 $2.09 $2.33 11.48% SKY Lofts 14 68 $2.45 $2.70 10.20% The Tomahawk - - - - - Toy Factory 2 34 $2.17 $2.11 2.76% Toy Warehouse 1 43 $1.74 $1.68 3.45% Totals & Averages 356 35 $2.45 $2.67 8.82% Data from CLAW MLS Copyright Loftway 2015 The Loftway Report | Downtown LA | Year of 2015 | loftway.com | BRE: 01412928