Download
1 / 37
380 likes | 981 Views
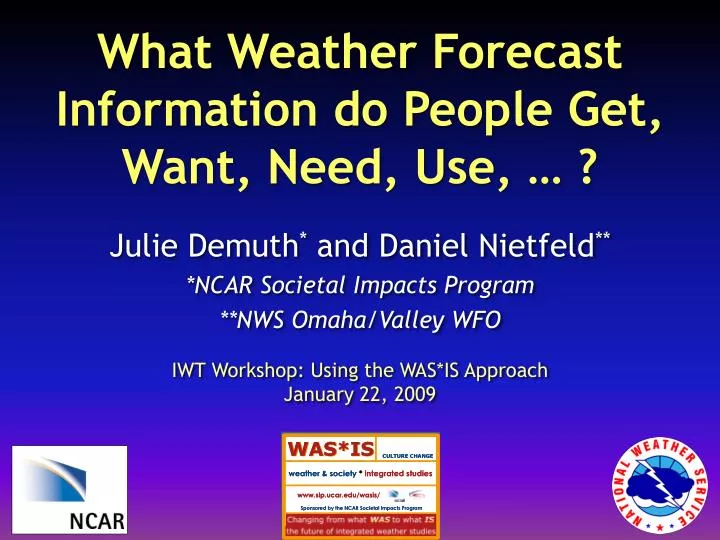
What Weather Forecast Information do People Get, Want, Need, Use, … ? Julie Demuth * and Daniel Nietfeld ** *NCAR Societal Impacts Program **NWS Omaha/Valley WFO IWT Workshop: Using the WAS*IS Approach January 22, 2009 Do you normally get forecasts during the time periods listed below?

E N D
What Weather Forecast Information do People Get, Want, Need, Use, … ? Julie Demuth* and Daniel Nietfeld** *NCAR Societal Impacts Program **NWS Omaha/Valley WFO IWT Workshop: Using the WAS*IS Approach January 22, 2009
Do you normally get forecasts during the time periods listed below? From 12 a.m. to before 6 a.m. From 6 a.m. to before 8 a.m. From 8 a.m. to before 11 a.m. From 11 a.m. to before 1 p.m. From 1 p.m. to before 4 p.m. From 4 p.m. to before 7 p.m. From 7 p.m. to before 12 a.m.
The forecast high temperature for Kansas City tomorrow is 40ºF. What do you think the actual high temp will be? 40ºF 39-41ºF 38-42ºF 35-45ºF 30-50ºF
There is a 30% chance for freezing rain tomorrow. What are your concerns for a hazardous impact?
Outline • Julie: Survey findings about people’s • sources, perceptions, and uses of weather forecast information • perceptions of, interpretations of, and preferences for uncertainty information • Daniel: What does it all mean?!
Julie (NCAR) and Daniel (NWS) • Julie, the researcher, provides great questions, and great answers, and great research findings… • Daniel, the operational guy, takes Julies findings and applies them to the real world… • One without the other is only half-effective … 50% effectiveness rarely makes a difference • Julie and Daniel, partner and learn from each other!
Julie et al.’s survey design and implementation • Nationwide, controlled-access web survey of U.S. public • Pre-tested during development and implementation • Respondent population: • is geographically diverse with responses from every state • has similar gender and race distribution to the U.S. public • is slightly older and more educated N=1520 completed responses, but 3.6% of people say they never use weather forecasts … this analysis based on N=1465 responses
Screenshot of sources question There is a science to doing surveys!
Weather forecast questions • From where and how often do people get weather forecast information? • What times of day do people get forecasts? • For what reasons do people get forecasts? • What weather forecast parameters are important to people? • For what locations or regions do people get forecasts? • What is people’s willingness to pay for forecasts? (See Lazo et al. 2009 for all results)
How often do you get forecasts from the sources listed? • Response options • Rarely or never • Once or more a month • Once a week • Two or more times a week • Once a day • Two or more times a day recoded to lower-bound quantitative count of sources per month • 0 times per month • 1 • 4 • 8 • 30 • 60
What does this mean to us ??? • Certainly can NOT assume that, at any given time, people know what the latest forecast is • In rapidly changing weather conditions, the forecast may change frequently (5-6 X / day) • What can we assume? Lowest common denominator… “THEY DON’T KNOW THE CURRENT FORECAST”
Mean # of forecasts obtained monthly Local TV Cable TV Commercial or public radio Other webpages Average respondent gets weather forecasts 115 times per month. Nearly 226 million U.S. adults 300 billion+ forecasts per year!* Newspapers NWS webpages Friends, family, co-workers, etc. NOAA Weather Radio Cell phone, PDA, pager, etc. Telephone weather info source 0 5 10 15 20 25 30 35 40 * Accounts for 3.6% of respondents who never use weather forecasts. N=1465
What does this mean to us ??? • MOST people do NOT have access to instantaneous weather information such as NOAA Weather Radio or a pager • You TV folks play a major role (news flash!) • Timely internet updates are important • There are MANY sources of weather information
Time forecasts normally received 80% 70% 60% 50% 40% 30% 20% 10% 0% 12a-6a 6a-8a 8a-11a 11a-1p 1p-4p 4p-7p 7p-12a N=1465
What does this mean to us ??? • Morning TV Broadcast Meteorologist may play just as important of a role as the evening Chief (?) • 1 pm – 4 pm is when people are paying the least attention to the weather forecast • When are watches often issued ? • When do warnings often begin ? • 4 pm – 7 pm appears to be “an accident waiting to happen” • 4 pm is a common shift change in NWS and TV • People are tuning in • The cap breaks!
Importance of weather parameters When precip will occur Chance of precip Where precip will occur Type of precip High temp Amount of precip Chance of amount of precip Low temp Wind speed Humidity levels Time of day high temp will occur Time of day low temp will occur How cloudy it will be Wind direction 0% 20% 40% 60% 80% 100% Extremely important Very important Somewhat important N=1465 A little important Not at all important
What does this mean to us ??? • Top 4 are precipitation-related • Connection between precipitation, storms the high-impact weather that affects people, that has societal relevance! • More emphasis on when and where precip occur? Even on PQPF (chance of amount of precip)? • There is more dark blue than light blue!
Forecast uncertainty questions • How much confidence do people have in different types of weather forecasts? • Do people infer uncertainty into deterministic forecasts and, if so, how much? • How do people interpret a type of uncertainty forecast that is already commonly available and familiar: probability of precipitation forecasts? • To what extent do people prefer to receive deterministic vs. uncertainty-explicit forecasts? • In what formats do people prefer to receive forecast uncertainty information? (See Morss et al. 2008 for all results)
Confidence in weather forecasts < 1 day 1 day 2 day Forecast Lead Time 3 day 5 day 7-14 day 0% 20% 40% 60% 80% 100% N=1465 Very high High Medium Low Very low
Hazardous Weather • Outlook: • Two sections… • Day One (detailed) • Days 2-7 (???) • (more vague) • (inferred uncertainty?) What does this mean to you ? HAZARDOUS WEATHER OUTLOOK NATIONAL WEATHER SERVICE KANSAS CITY/PLEASANT HILL MO 600 AM CST WED JAN 14 2009 .DAY ONE...TODAY AND TONIGHT AN ARCTIC AIRMASS WILL OVERSPREAD THE REGION TODAY. TEMPERATURES WILL DROP TO BITTERLY COLD LEVELS BY TONIGHT...WITH WIND CHILLS REACHING 15 TO 25 BELOW ZERO ALONG AND NORTH OF A LINE FROM ATCHISON KANSAS TO RICHMOND...MARSHALL AND BOONVILLE. LIGHT SNOW OR FLURRIES IS ALSO POSSIBLE WITH THE PASSAGE OF THE COLD FRONT...HOWEVER LITTLE IF ANY ACCUMULATION IS EXPECTED. .DAYS TWO THROUGH SEVEN...THURSDAY THROUGH TUESDAY DAYTIME HIGHS ON THURSDAY WILL RANGE FROM 15 TO 25 DEGREES BELOW AVERAGE. THE ALREADY COLD START WILL HELP PUSH THURSDAY NIGHT LOW TEMPERATURES BACK INTO THE SINGLE DIGITS BELOW ZERO ACROSS NORTHERN MISSOURI. IN ADDITION...SOUTHWESTERLY WINDS MAY START TO INCREASE LATE THURSDAY NIGHT...POSSIBLY LEADING TO ANOTHER WIND CHILL ADVISORY FOR A PORTION OF FAR NORTHERN AND NORTHEAST MISSOURI.
Suppose the forecast high temperature for tomorrow for your area is 75°F. What do you think the actual high temperature will be? 50% 40% 30% 20% 10% 0% 75°F 74-76°F 73-77°F 70-80°F 65-85°F Other (± 1°F) (± 2°F) (± 5°F) (± 10°F) N=1465
Suppose the forecast says, “There is a 60% chance of rain tomorrow.” 16% 10% 19% 23% 9% 24% What do you think best describes what the forecast means? Response option Percent of respondents It will rain tomorrow in 60% of the region. It will rain tomorrow for 60% of the time. It will rain on 60% of the days like tomorrow.* 60% of weather forecasters believe that it will rain tomorrow. I don’t know. Other (please explain) * Technically correct interpretation, according to how PoP forecasts are verified N=1330
Open-ended responses re: PoP • Many reiterate PoP without clarification • Many describe the chance they’ll personally experience rain or personal implications for action • Consistent with other studies, majority of people don’t know technically correct definition of PoP… • …but asking people to think about PoP from a meteorological perspective may have limited value … people still have to translate what it means to them personally!
Definition of SPC probablities • The probabilities that you see on the graphics represent the probability of one or more events occurring within 25 miles of any point during the outlook period. This definition is used as the probability of severe weather at an given point is quite small. There is a large amount of uncertainty in forecasting severe weather on these scales. How many times have you experienced a tornado in your neighborhood? For most people, the answer is never. Now think of how many times severe weather has occurred within 25 miles of your location. Probability of Severe Hail ¾” or larger
5% Probability of a Tornado… • Is this a relatively high probability to you? • 5% probability of a tornado within 25 miles of where you are! • Is this a reasonable threat to you ? • To you as a: • 22 year old college student • School superintendent ? • Factory manager ? • Large event Director ? • Emergency Manager ?
You are watching the local evening news • The Channel A weather forecaster says the high temperature will be 76°F tomorrow • The Channel B weather forecaster says the high temperature will be between 74°F and 78°F tomorrow. Prefer Channel A (deterministic) Prefer Channel B (uncertainty) Like both channels Like neither channel I don't know 0% 10% 20% 30% 40% 50% N=1465
All the choices below are the same as a probability of precipitation of 20%. Do you like the information given this way? Chance of precipitation is 20% There is a 1 in 5 chanceof precipitation Theodds are 1 to 4that it will rain There is a slight chanceof rain tomorrow Percent Frequency Odds Text Asked this question 3 ways − using PoPs of 20%, 50%, and 80% with corresponding text descriptions from NWS
Percent of respondents who said “yes” 100% PoP of 20% PoP of 50% PoP of 80% 80% 60% 40% 20% 0% Percent Frequency Odds Text N = 489, 489, 487
Suppose the high temperature tomorrow will probably be 85ºF. A cold front may move through, making the high only 70ºF. …will most likely be 85°F, but it may be 70°F (WITHOUT explanation) …will most likely be 85°F, but it may be 70°F, because a cold front may move through (WITH explanation) …will be between 70°F and 85°F …will be between 70°F and 85°F, because a cold front may move through 80% chance it will be 85°F, 20% chance it will be 70°F 80% chance it will be 85°F, 20% chance it will be 70°F, because a cold front may move through Would you like the forecast given this way? The high temperature tomorrow… …will be 85°F
Percent of respondents who said “yes" Deterministic ~35% Will be 85°F Deterministic only ~7% 0% 10% 20% 30% 40% 50% 60% Without cold front explanation With cold front explanation Most likely 85°F but may be 70°F Uncertainty >90% Between 70-85°F Uncertainty only ~63% 80% chance 85°F, 20% chance 70°F 0% 10% 20% 30% 40% 50% 60% N=1465
People want to know the possibilities! • Area Forecast Discussion (AFD) • Warning Decision Update product • Severe Wx Outlook discussion • TV Broadcaster discussing the range of possibilities!
Warning Decision Update ...WARNING DECISION UPDATE... ...THIS WARNING DECISION UPDATE CONCERNS SOUTHWEST OKLAHOMA... LINE/CLUSTER OF CONVECTIVE CELLS NORTHEAST OF LAWTON IS VERY LOW TOPPED (20 K FT) AND ARE ASSOCIATED WITH REMAINS OF MESOSCALE CONVECTIVE VORT MAX (MCV) LEFT OVER FROM STORMS IN WEST TEXAS EARLIER. ENVIRONMENT IS SUPPORTIVE OF VERY BRIEF FUNNEL CLOUDS OR PERHAPS A WEAK TORNADO... BUT DO NOT BELIEVE CONDITIONS WILL SUPPORT WELL ORGANIZED MESOCYCLONE TYPE TORNADOESOR OTHER FORMS OF SEVERE WEATHER. RECENT RADAR TRENDS SUGGEST CELLS ARE BECOMING INCREASINGLY LESS ORGANIZED AS THEY MOVE INTO MORE STABLE AIR. WILL CONTINUE TO MONITOR TRENDS IN Z/V DATA FROM KFDR/KTLX FOR ANY SIGNS CONTRARY TO THIS EXPECTED EVOLUTION. $$ ANDRA
Severe Weather Responses ? • If we have this much variety amongst routine weather forecast information, imagine the variety amongst severe weather warning/watch/forecast information !!!
Discussion questions • What other questions do we need to explore about people’s attitudes and behaviors? On a day-to-day basis? During high-impact events? • This was a first look at members of the public… How can we tap into the knowledge and experience of IWT members? • Broadcast meteorologists (e.g., focus groups) • NWS forecasters • Emergency managers and other public officials
Thank you • Julie Demuth (jdemuth@ucar.edu) • Daniel Nietfeld (dan.nietfeld@noaa.gov) • References • Morss, R.E., J.L. Demuth, J.K. Lazo, 2008: Communicating uncertainty in weather forecasts: A survey of the U.S. public. Wea. Forecasting, 23, 974-991. • Lazo, J. K., R.E. Morss, and J.L. Demuth, 2008: 300 billion served: Sources, perceptions, uses, and values of weather forecasts. Bull. Amer. Meteor. Soc., in press. • Demuth, J.L, B.H. Morrow, J.K. Lazo, 2009: Providing weather forecast information: An exploratory study with broadcast meteorologist. Bull. Amer. Meteor. Soc., submitted.