Garch-m
Garch-m. The process or return is dependent on the volatility. , c are constants. C is the “risk premium parameter”; c>0 indicates the return is positively related to its volatility. Output from Splus m-garch fit garch(x~1+var.in.mean,~garch(1,1)). Estimated Coefficients:

Garch-m
E N D
Presentation Transcript
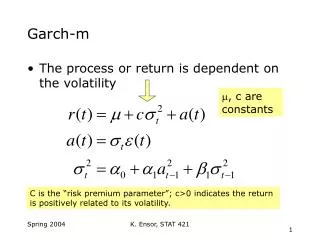
Garch-m • The process or return is dependent on the volatility , c are constants C is the “risk premium parameter”; c>0 indicates the return is positively related to its volatility. K. Ensor, STAT 421
Output from Splus m-garch fit • garch(x~1+var.in.mean,~garch(1,1)) Estimated Coefficients: -------------------------------------------------------------- Value Std.Error t value Pr(>|t|) C 0.00548675 0.00226173 2.426 7.747e-003 ARCH-IN-MEAN 1.08783589 0.81822755 1.330 9.203e-002 A 0.00008764 0.00002507 3.496 2.494e-004 ARCH(1) 0.12268468 0.02047268 5.993 1.571e-009 GARCH(1) 0.84939373 0.01957565 43.390 0.000e+000 -------------------------------------------------------------- Differs from Tsay’s fit slightly. K. Ensor, STAT 421
Square root Of volatility S&P500 Index K. Ensor, STAT 421
Summary Graphs K. Ensor, STAT 421
Hong Kong stock market index return (bottom graph) and estimated volatility. K. Ensor, STAT 421
garchfit<-garch(HK~-1+arma(1,0),~garch(1,1),cond.dist="t",dist.est=T)garchfit<-garch(HK~-1+arma(1,0),~garch(1,1),cond.dist="t",dist.est=T) • Estimated Coefficients: • -------------------------------------------------------------- • Value Std.Error t value Pr(>|t|) • AR(1) 0.0450 0.04578 0.983 0.163052 • A 0.1688 0.08404 2.009 0.022568 • ARCH(1) 0.1700 0.05835 2.913 0.001871 • GARCH(1) 0.7732 0.06454 11.980 0.000000 • -------------------------------------------------------------- K. Ensor, STAT 421
HK - Garch fit +/- 2SD K. Ensor, STAT 421
garchfit<-garch(HK~-1+arma(1,0),~garch(1,1),cond.dist="gaussian",dist.est=T)garchfit<-garch(HK~-1+arma(1,0),~garch(1,1),cond.dist="gaussian",dist.est=T) • -------------------------------------------------------------- • Estimated Coefficients: • -------------------------------------------------------------- • Value Std.Error t value Pr(>|t|) • AR(1) 0.1199 0.05709 2.100 1.811e-002 • A 0.1424 0.04834 2.946 1.687e-003 • ARCH(1) 0.1782 0.03693 4.827 9.287e-007 • GARCH(1) 0.7592 0.04913 15.452 0.000e+000 • -------------------------------------------------------------- K. Ensor, STAT 421
Japanese stock market index and volatility based on Gaussian GARCH(1,1) model K. Ensor, STAT 421
garchfit<-garch(JI~-1,~garch(1,1),cond.dist="gaussian",dist.est=T)garchfit<-garch(JI~-1,~garch(1,1),cond.dist="gaussian",dist.est=T) • -------------------------------------------------------------- • Estimated Coefficients: • -------------------------------------------------------------- • Value Std.Error t value Pr(>|t|) • A 0.1352 0.04517 2.993 1.452e-003 • ARCH(1) 0.1713 0.03409 5.024 3.552e-007 • GARCH(1) 0.7708 0.04609 16.722 0.000e+000 • -------------------------------------------------------------- K. Ensor, STAT 421
JI K. Ensor, STAT 421
JI K. Ensor, STAT 421
Let’s trying looking at the multivariate GARCH. K. Ensor, STAT 421
Series 1: Hong Kong Stock Index Series 2: Japanese Stock Index K. Ensor, STAT 421
Series 1: Hong Kong Stock Index Squared Series 2: Japanese Stock Index Squared K. Ensor, STAT 421
---------------------------------------------------------------------------------------------------------------------------- • Estimated Coefficients: • -------------------------------------------------------------- • Value Std.Error t value Pr(>|t|) • AR(1; 1, 1) 0.124329 0.058850 2.1126 1.757e-002 • AR(1; 2, 2) 0.017088 0.047872 0.3569 3.606e-001 • A(1, 1) 0.144756 0.050129 2.8877 2.027e-003 • A(2, 2) 0.003265 0.006921 0.4718 3.187e-001 • ARCH(1; 1, 1) 0.186976 0.039732 4.7059 1.649e-006 • ARCH(1; 2, 2) 0.069114 0.016141 4.2818 1.117e-005 • GARCH(1; 1, 1) 0.755876 0.050284 15.0320 0.000e+000 • GARCH(1; 2, 2) 0.937297 0.017199 54.4981 0.000e+000 • -------------------------------------------------------------- • mgarchfit=mgarch(X~-1+arma(1,0),~garch(1,1)) Page 367 of text K. Ensor, STAT 421