Download

1 / 31
310 likes | 754 Views
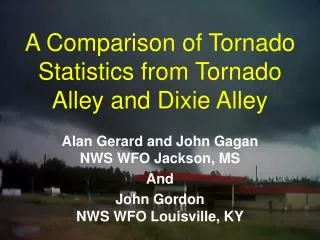
A Comparison of Tornado Statistics from Tornado Alley and Dixie Alley. Alan Gerard and John Gagan NWS WFO Jackson, MS And John Gordon NWS WFO Louisville, KY. Tornado Alley?. www.cdli.ca/CITE/tornadoes_alley.htm. Tornado Alley Definitions:.

E N D
A Comparison of Tornado Statistics from Tornado Alley and Dixie Alley Alan Gerard and John Gagan NWS WFO Jackson, MS And John Gordon NWS WFO Louisville, KY
Tornado Alley? www.cdli.ca/CITE/tornadoes_alley.htm
Tornado Alley Definitions: • Region in the middle of the United States where more tornadoes occur than anywhere else in the world. • Most tornadoes in the United States form in an area called "Tornado Alley". This area includes parts of Texas, Oklahoma, Kansas, and Nebraska.www.windows.ucar.edu/tour/link=/earth/Atmosphere/tornado/alley.html • Where is tornado alley?geography.about.com/library/faq/blqztornadoalley.htm • “The United States “Tornado Alley”, stretches from northwest TXacross OK and through northeast KS.”
Fawbush and Miller 1948 The weather situation is discussed by Capt. Robert C. Miller (left) and Lieut. Col. E. J. Fawbush
Perception • “Historically, the term “tornado alley” has been used loosely, and the locations indicated are often based on personal perception rather than scientific data. (“The Tornado Nature's Ultimate Windstorm” pg 278 Grazulis) • Wizard of Oz
Origins of Tornado Alleys. • Personally spoke to Doswell, Grazulis, Dan McCarthy, Joe Schaeffer, Howie Bluestein, Fred Ostby, and Allen Pearson about the origins of Tornado Alley. • Searched many books (including Flora and internet sources) • No one knew the origins of Tornado Alley. • Found papers from Kelly 78 et al., Concannon 2000 et al., Grazulis books, and no definitive answer.
Fawbush and Miller • On Feb 15, 1952, Fawbush and Miller set up a new project called, "Tornado Alley," in which a concentrated study of severe weather activity was made over an area extending from Lubbock, Texas to Eastern Colorado and Nebraska. • This was done in stages, the 1st being from LUB-END, & 2nd from END north to the Nebraska line.
Many Different Alleys • “Evidence of smaller tornado alleys across the United States based on a long track F3 to F5 tornado climatology study from 1880 to 2003" (Broyles and Crosbie 2004) • “There is more than one tornado alley. Any area that seems to experience above average tornado frequency is eventually labeled a “tornado alley.” There are dozens of such regions. (Grazulis The Tornado Nature's Ultimate Windstorm pg 278).
Dixie Alley Origins • AR/TN OUTBREAK: March 21-22, 1952 28 tornadoes * 204 deaths First tornado watch ever issued by NWS • MS Delta Outbreak Feb 21, 1971: 10 tornadoes 121 deaths, 1524 injuries
Dixie Alley • However…Pearson… Named Dixie Alley after 71 Outbreak in MS Delta (no formal documentation that we can locate).
Jeopardy Question? Which alley is under the greatest threat of tornadoes for the entire year? • Plains Tornado Alley • Dixie Alley
Plains Alley and Dixie Alley Breakdown • Plains Alley • Size: 407,734 sq mi • Population: 17,824,023 • Dixie Alley • Size: 276,890 sq mi • Population: 24,948,345 Population Data from the 2000 Census
Methodology • Our own depictions of Tornado Alley and Dixie Alley are “personal” • Data is from 1950 to 2003 and is derived from the SPC “ONETOR” database • “A close approximation to actual tornadoes.” • Focused on strong/violent tornadoes • Data not normalized for population or spatial extent
Post NWS Modernization • In addition to the longer term statistics, felt it would be revealing to compare to post-NWS modernization. • Increased number of tornadoes since deployment of 88D. • Increased ability to see potentially tornadic storms. • More emphasis on verification/storm data. • Look at statistics from 1998-2004, focusing particularly on strong tornadoes.
Methodology • Used same definitions of “Tornado Alley” and “Dixie Alley.” • Looked at total tornadoes, strong tornadoes, strong tornado days, and numbers of tornadoes, by month. • Data taken from the NWS storm data/verification homepage. • Subject to potential biases • County based versus “track” based • Population density and county size potential biases same as longer term dataset.
Summary of Stats • Dixie Alley had about 1.5 times as many strong tornadoes as Tornado Alley (338 vs 206) while Tornado Alley had more tornadoes overall (2278 vs. 1703) • Killer tornadoes much more prevalent in Dixie Alley area than Tornado Alley • 66 vs 24 • Dixie Alley had twice the number of “outbreak days” • 9 days with 10+ strong tornadoes versus 5 in Tornado Alley
Annual Trend • 76% of strong tornado days in Tornado Alley occur in a three month period (April, May, June) • Adding March in takes the value to nearly 90% • The highest percentage over a three month period in Dixie Alley is 46% (March, April, May) • The next two highest three month periods are February, March, April (41%) and November, December, January (37%) • Eight out of 12 months (Oct-May) have at least 5% of the annual strong tornado days for Dixie Alley • Only 5 out of 12 for Tornado Alley (Mar-June, Oct)
Over the last several years in Dixie Alley • March has been significantly below long-term “normal” with regard to strong/violent tornadoes • November has been significantly above normal with regard to strong/violent tornadoes
Conclusions • Confirms validity of Plains Tornado Alley • Not meant to diminish magnitude of risk in this area • Highlights magnitude of tornado risk in Dixie Alley area • Strong/violent tornadoes as prevalent • Killer tornadoes much more prevalent • Temporal aspect of threat much different in Dixie Alley versus Plains Tornado Alley • Threat most of year – killer strong/violent tornadoes not uncommon in late fall/winter months!! • While a peak in strong/killer tornadoes occurs in late afternoon and evening, a much higher risk exists in the 9 pm to 5 am timeframe than in the Plains Tornado Alley.
Tornado fatalities declined by a similar magnitude between 1916 and 1965 as between 1966 and 2005 More rapid dropoff in latter period suggests improved warnings/technology played large role… BUT outbreaks of violent tornadoes will probably still be big killers!