1 / 7

Why Businesses Need Data Visualization Consulting Services

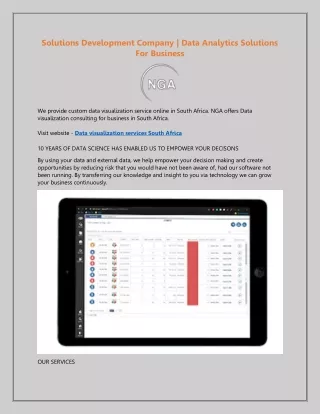
Businesses can leverage Data Visualization Consulting Services to enhance reporting, track key performance indicators (KPIs), and gain deeper insights into customer behavior, market trends, and operational efficiency.<br><br>

Kaliper
Download Presentation

Why Businesses Need Data Visualization Consulting Services

An Image/Link below is provided (as is) to download presentation Download Policy: Content on the Website is provided to you AS IS for your information and personal use and may not be sold / licensed / shared on other websites without getting consent from its author. Content is provided to you AS IS for your information and personal use only. Download presentation by click this link. While downloading, if for some reason you are not able to download a presentation, the publisher may have deleted the file from their server. During download, if you can't get a presentation, the file might be deleted by the publisher.

E N D

Presentation Transcript


  1. DATA VISUALIZATION CONSULTING SERVICES Transforming Data into Actionable Insights

  2. Why Data Visualization Matters? Data visualization is essential for transforming complex datasets into clear, actionable insights. By presenting data in intuitive charts, graphs, and interactive dashboards, businesses can quickly identify trends, uncover hidden patterns, and make data- driven decisions with confidence. It enhances communication across teams, improves operational efficiency, and enables stakeholders to grasp key metrics at a glance. In an era where data is a competitive advantage, effective visualization bridges the gap between raw numbers and strategic decision- making, empowering organizations to turn information into impact.

  3. Key Benefits of Our Services Custom Dashboards & Reports – Get tailored visualizations that align with your business goals for better decision-making. Interactive Visual Analytics – Explore data dynamically with filters, drill-downs, and real-time updates. Scalable & Secure Solutions – Ensure your data visualizations grow with your business while maintaining security.

  4. Our Data Visualization Services Business Intelligence (BI) Dashboards – Design and implement interactive BI dashboards using tools like Power BI, Tableau, and Looker Data Storytelling & Reporting – Transform raw data into compelling visual narratives that make complex insights easy to understand Custom Visualization Solutions – Develop tailored data visualizations, from advanced charts to geospatial mapping, ensuring clarity and relevance Integration with Multiple Data Sources – Connect and unify data from various platforms, including CRM, ERP, cloud storage, and third-party APIs

  5. Tools & Technologies Use in Data Visualization Power BI – A Microsoft-powered business intelligence tool that enables users to create interactive dashboards, connect to multiple data sources, and generate real-time insights. My education milestones Tableau – A powerful data visualization platform known for its user-friendly interface and advanced analytics capabilities. Looker – A cloud-based data exploration and analytics tool from Google Cloud. Looker specializes in modeling and querying large datasets efficiently. Python & R for Data Visualization – These programming languages are widely used for statistical analysis and advanced data visualization. D3.js – A JavaScript library for creating custom, web- based data visualizations. Unlike traditional BI tools, D3.js provides complete control.

  6. Our Process 02 03 04 05 01 Requirement Analysis – This initial phase involves understanding the client’s business goals, data sources, key performance indicators (KPIs), and reporting needs. Data Collection & Preparation – Raw data is gathered from various sources such as databases, cloud storage, APIs, and spreadsheets. Visualization Design – In this stage, consultants create mockups or prototypes of dashboards and reports, selecting the best charts, graphs, and UI/UX elements to convey insights effectively. Implementation & Optimization – The designed visualizations are developed using tools like Power BI, Tableau, Looker, or custom-built solutions. Ongoing Support – After deployment, continuous support is provided to maintain, update, and improve the visualization solutions.

  7. THANK TOU For watching this presentation sales@kaliper.io www.kaliper.io https://x.com/kaliper_io

More Related