Interactive Dashboards Powered by Data Visualization Consulting Services
Build dynamic dashboards and real-time analytics with our expert data visualization consulting services. We enable businesses to discover trends, track KPIs, and make data-backed decisions with confidence. Request a free demo and see your data in action today.


Interactive Dashboards Powered by Data Visualization Consulting Services
E N D
Presentation Transcript
Data Visualization Consulting Services Transforming complex data into actionable insights www.kaliper.io
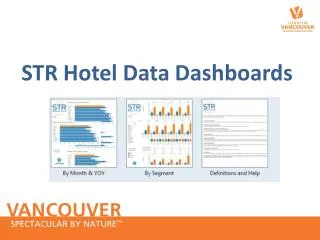
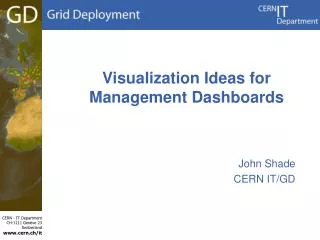
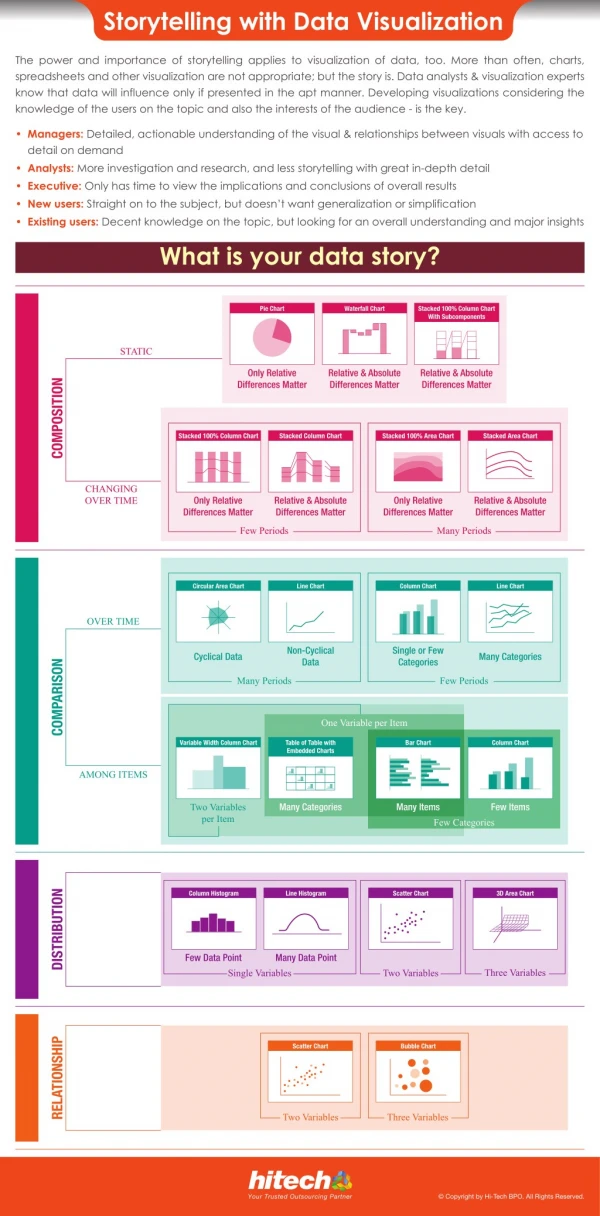
Introduction to Data Visualization Consulting Helping businesses turn raw data into meaningful visuals Improving decision-making with interactive dashboards Enabling data-driven strategies through visual insights Read More
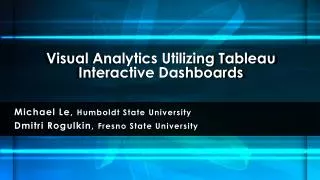
Key Services Offered Custom Dashboard Development (Tableau, Power BI, Looker) Data Storytelling and Visual Reporting Real-Time Data Visualization Solutions Data Pipeline Integration for seamless visualization
Benefits of Data Visualization Consulting 01 02 03 04 Enhanced understanding of complex datasets Faster decision-making with clear visuals Improved collaboration across teams Identification of trends and anomalies quickly
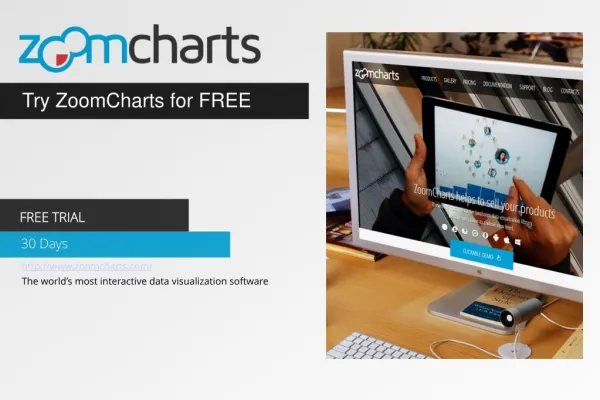
Technologies and Tools Used in Data Visualization Consulting Services 01 02 03 04 Tools such as Apache Airflow, Talend, and Fivetran automate data preparation, making visualization faster and more accurate. Tableau, Power BI, Looker, D3.js Cloud-based visualization platforms (AWS, Azure, GCP) Integration with Data Warehouses (Snowflake, Redshift)
Data assessment and strategy planning Dashboard design and development Process and Approach in Data Visualization Consulting Services Testing and optimization for usability Training and support for internal teams
Kaliper - Data Analytics & AI Experts www.kaliper.io sales@kaliper.io www.linkedin.com/company/kaliperservices