Download
1 / 13
130 likes | 588 Views
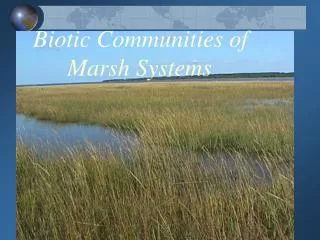
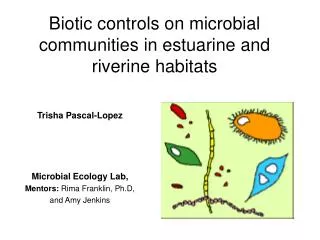
Biotic controls on microbial communities in estuarine and riverine habitats . Trisha Pascal-Lopez Microbial Ecology Lab, Mentors: Rima Franklin, Ph.D, and Amy Jenkins. Nutrient Input (ex. farm runoff) Algal Bloom (consumed by bacteria) Bacteria (hypoxia) Marine creature die

E N D
Biotic controls on microbial communities in estuarine and riverine habitats Trisha Pascal-Lopez Microbial Ecology Lab, Mentors: Rima Franklin, Ph.D, and Amy Jenkins
Nutrient Input (ex. farm runoff) • Algal Bloom (consumed by bacteria) • Bacteria (hypoxia) • Marine creature die • Trophic cascade
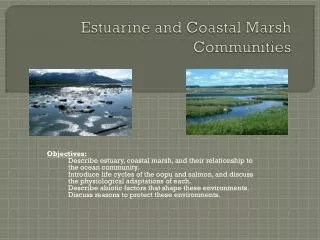
A. Purpose • Study the ecological relationships that occur in an aquatic microbial food web • To understand the interdependence of three levels of the food web (phytoplankton, bacteria, and grazers) • Focus on response of bacteria to other community members www.jerrygreerphotography.com/james_river_summer_reflection.htm
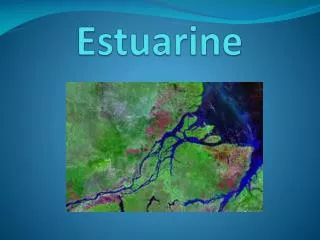
B. Setup 1) Two different initial environment samples: • James River mile 21 (Estuarine) • James River Rice Center (Riverine) Courtesy of Paul Bukaveckas & River Ecology lab
B. Setup 2) Four treatments: • Manipulated light and dark levels • Eukaryotic growth inhibitor (cycloheximide) • 3 replicate of each treatment per environment, 3 day incubation
Methods 1) Phytoplankton community: • Fluorescence detection of chlorophyll levels 2) Bacterial community: • Abundance (microscopic direct counts) • Culturability (counts of solid media/agar) • Genetic profiling (RAPD DNA fingerprints) 3) Grazer community: • Abundance and diversity (microscopic determination) • Mainly protozoa, rotifers and larvae www.compucyte.com/pubbacterialdetection.htm
C. Results Estuary site Initial comparison • Distinct communities at start of experiment • Estuary had lower phytoplankton, grazer and bacteria abundance than riverine site (Rice). Rice Center
Were the treatments effective? • Changes to the phytoplankton population (greater for estuary) • Affected estuary & riverine phytoplankton differently • Reduced grazer abundance • Grazers linked to phytoplankton? • Decrease in grazer diversity
How did bacteria respond to the changes in the phytoplankton and grazer abundance/ diversity? Estuary: Bacteria abundance not linked to phytoplankton or grazers abundances (unaffected in all treatments). Rice Center (Riverine): Treatments had an effect on bacterial community.
Light + cyclohex. Dark + cyclohex. Light Dark Light + cyclohex. Dark + cyclohex. Light Dark Changes in bacterial community composition? Estuary: Community composition similar in all treatments River: Changes in bacterial community with each treatment.
Implications • Microbial communities in the Estuarine and Riverine environments are different. • Estuarine environment bacterial communities are not linked to grazer or phytoplankton abundance • Riverine environment shows bacterial interactions with phytoplankton and grazer communities • Microbial community interactions vary depending on the environment which controls their response to environmental stress.
D. Future Goals • Statistical analysis of data • Chemistry (Nitrogen and DOC) • Run the experiment again with changes • Add another mile marker • Collect water sample at different seasons or times of day • Manipulate nutrient concentration
Questions? Thank You