Download
1 / 37
380 likes | 583 Views
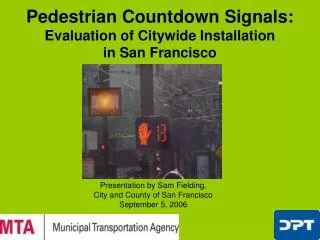
Pedestrian Countdown Signals: Evaluation of Citywide Installation in San Francisco. Presentation by Sam Fielding, City and County of San Francisco September 5, 2006. Walking in San Francisco: Unique Characteristics.

E N D
Pedestrian Countdown Signals:Evaluation of Citywide Installation in San Francisco Presentation by Sam Fielding, City and County of San FranciscoSeptember 5, 2006
Walking in San Francisco: Unique Characteristics • Dense urban area: 47 square miles • Estimated Population 2005 799,263 • Estimated Daytime Population 945,480 • No. of Jobs (2000) 628,860 • Non-SF Residents Commuting to SF (2000) 261,181 • Total Registered Vehicles (2004) 382,795 • Total Daytime Increase in Vehicles +35,400 • Means of Transportation to Work: Approximately 10% of SF residents walk to work, 2% bike to work (highest percentage for cities with pop. higher than 500,000, higher than Portland, Seattle, San Jose or any other major city). • Diverse transit system: Diesel Buses, Cable Cars, Streetcars, Light Rail Vehicles and Trolley buses (1045 service vehicles not including BART, Golden Gate Transit, AC Transit, Caltrain) Serve 30% of SF residents.
PEDESTRIAN COLLISION TRENDSS.F. 2005 Collision Report • The 2005 total of 699 ped. injury collisions is up 5 percent from the 2004 total, which had been the lowest in the past decade. (Figure 3) • The increase follows a similar citywide increase in vehicle only collisions. • Rise in ped. collisions is more likely due to overall fluctuation on aggregated collision totals than due to factors specific to pedestrian safety. • Ped. injury collisions are down 31 percent from 1996 total • The number of ped. fatal collisions decreased to 14 and was the lowest among previous yearly totals (Figure 4)
Pedestrian related Source: CA Highway Patrol Statewide Integrated Traffic Records Systems (SWTRS), Jan. 2001- Dec.2005
Countdown Signals Program • Countdown signals initially installed at 14 test locations in March, 2001. 9 were assessed. • City eventually replaced most pedestrian signals with Countdown Signals (over 800 intersections so far out of 1200 signalized) • Since they are more energy-efficient, electricity savings will eventually pay for LED device installation
City Pedestrian Countdown Policy • Our goal is to add pedestrian countdown signals to all intersections with traffic signals (with possible rare exception of intersections with minimal pedestrian volumes, like a truck crossing in an industrial park).
Pilot Installation Countdown Questions • Will cars speed up to make the light? • Will more pedestrians start to cross on the Flashing Red Hand? • Is it better to start the countdown on the Flashing Red Hand or on the Walk symbol? • Will pedestrians be able to judge how much time it takes them to cross? • Will the intersections be safer?
Evaluation Questions • Will pedestrian collision rates continue to decrease after further countdown installations? • Will countdowns reduce red light running violations? • What has been the experience with pedestrian behavior and attitudes, motorist behavior and signal maintenance? • Will more peds finish crossing before the red?
Countdown SignalsStudy at Pilot Locations Showed: • Pedestrian injuries much lower after countdowns installed, but not significantly lower than comparable intersections (This is due to Regression to the Mean) • No significant increase in pedestrians starting to cross at the beginning of the clearance interval • No increase in red light running • Pedestrians like the additional information on how much time left to cross the street
All Collisions: Red Light Running Pre and Post Countdown Installation * Based on 2,527 reported collision records Red Light Running could have been impacted by pedestrian countdowns but other factors also probably involved include: City red light camera program (23 locations), FYG ped. crossing warning signs, fixed and portable radar signs, yield to ped. signs, more public safety outreach, etc.
Ped. Countdown ResultsFor All Pedestrian Collisions • Locations with pedestrian signals performed better after receiving countdown pedestrian signals • There was a 22% drop in all ped. collisions at intersections that had pedestrian signals (countdowns) installed • The control group of signalized intersections without ped. signals (countdowns) remained stable.
Pedestrian Countdown Next Steps • We want to analyze difference in collision patterns. • What category of violation or Primary Collision Factors went down after countdowns were installed? • Impact on collisions caused by drivers violating pedestrian right of way and peds crossing on reds.
Pilot Projects MTA/DPT is testing several new pedestrian safety technologies & approaches: • Pedestrian Countdown Signals • Fixed and portable radar speed signs • “Ped Head Starts” and “Ped Scrambles” (Signal Timing) • Extended Crossing Time • Audible Pedestrian Signals • Pop-Up/Brighter Warning Signs • Ladder Crosswalks • Flashing Beacons, “LOOK” markings
Pedestrian Scramble -1 • Gives pedestrians their own phases, cutting down conflicts with turning vehicles • Primary locations • Financial District • Chinatown • Initial studies show: • Conflicts between vehicles and pedestrians dropped 86% • Number of turning vehicles delayed by yielding to pedestrians in crosswalk dropped 89% at one intersection
Pedestrian Scramble-2 • Ideally, diagonal crossing allowed. • Best for: • Narrow intersections • Conflicts between high ped volumes and turning vehicles • Trade-offs, even for peds: • Longer waits • More queuing on sidewalk corners
Exclusive Pedestrian Phase (Pedestrian Scramble) Stockton/Jackson in Chinatown
Pedestrian Head Starts • 2-4 second (leading ped. interval) or head start WALK before parallel Green • Best for conflicts between heavy turning volumes and moderate to heavy pedestrian volumes • Used initially in SF for intersections with dual turn lanes • Examples: Mission & Ocean, 11th & Mission, Guerrero & Market, Fremont and Howard
Leading Pedestrian Interval (Pedestrian Headstart) Fremont/Howard
Pedestrian Safety Advisory Committee (PSAC) • Committee consisting of San Francisco residents including pedestrian advocacy group members and representatives from community organizations • Official advisor to the Board of Supervisors • Sets own agenda, both policy and design issues • Key focus is to provide public input into the Pedestrian Master Plan • Meets monthly
Other Key Departments • Police Department • Intensive pedestrian-related enforcement • Just starting “pedestrian stings” • Radar speed display trailers • Student crossing guards and school assemblies • Department of Public Works - Medians, ped. refuge islands, Curb ramp upgrades • Public Health Department • Outreach and education • Banners and posters • Mini-grants to community organizations • Injury severity studies, links to drug/alcohol hotspots
Education & Outreach • Media Campaigns-Public Service Announcements • Enforcement – Ped. stings,what’s acceptable behavior for motorists and pedestrians • Assemblies (especially for students, seniors) • Driver manual • Retroreflective materials
FUTURE PROJECTS • Continue Implementing Prop. K pedestrian safety projects and collaboration with Bicycle, School Area and Traffic Calming Programs • Continue pedestrian countdown signal installations • Continue scoring and installation of Audible Pedestrian Signals • Implementation of Golden Gate Park Pedestrian Improvement Plan
References Pedestrian Countdown Signals: Experience with an Extensive Pilot Installation, ITE Journal/January 2006. Frank Markowitz, Stanley Sciortino, PH.D., Jack Lucero Fleck, P.E. and Bond M. Yee, P.E. San Francisco 2005 Collision Report, July 19, 2006 San Francisco Transportation Fact Sheet, March 2006 Sam Fielding email: sam.fielding@sfmta.com Useful Websites: • San Francisco Pedestrian Program: http://www.sfgov.org/site/livablestreets_index.asp?id=14441 • Manual On Uniform Traffic Control Devices (MUTCD) http://mutcd.fhwa.dot.gov/kno-millennium.htm • Pedestrian and Bicycle Information Center: http://www.walkinginfo.org/