Download
1 / 20
210 likes | 332 Views
Learn about bias in research design and its impact on study results. Explore different stages where bias can occur and its classification into selection and information bias. Discover examples and effects of selection bias in various study types.

E N D
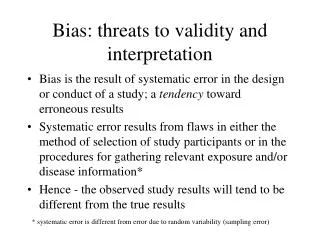
Bias: threats to validity and interpretation • Bias is the result of systematic error in the design or conduct of a study; a tendency toward erroneous results • Systematic error results from flaws in either the method of selection of study participants or in the procedures for gathering relevant exposure and/or disease information* • Hence - the observed study results will tend to be different from the true results * systematic error is different from error due to random variability (sampling error)
Stages of research in which bias may occur • In literature review or researching the field • In specifying and selecting the study sample • In measuring exposures and outcomes • In analyzing the data • In interpreting the analysis • In publishing the results
Bias can occur in all types of studies: descriptive, case-control and cohort bias • Descriptive data: • affects generalizability: may under- or overestimate prevalence or incidence of disease or exposure relative to the general population. • HIV prevalence among those living in SROs in SF • High blood pressure among elderly screened at an optometry clinic • Diabetes among women taking oral contraceptives
Classification of biasSelection or Information • Selection Bias: is present when individuals have different probabilities of being included in the study according to relevant study characteristics: namely the exposure and the outcome of interest • The book illustrates this in Figure 4.2, where exposed cases have a higher probability of being selected for the study than other categories of individuals.
REFERENCE POPULATION Diseased + - + - Exposed STUDY SAMPLE Figure 4.2
Examples of Selection Bias • Self-selection bias • self-referral • non-response bias • healthy worker effect • Prevalence-incidence bias (Neyman’s bias) • Medical surveillance bias • diagnostic bias • Berkson’s bias (admission rate)
Selection bias • Cross-sectional study: selection bias arises when affected, exposed individuals change their exposure status • Example: Cats may adversely affect the status of person with asthma. Persons with asthma worsened by exposure to cats would be less likely to have a cat than persons with asthma not similarly affected by cats.
Selection bias • In cohort studies, selection bias arises if drop-outs are more or less likely to include exposed and affected individuals - differential loss to follow-up: probability of the outcome is different in those who remain in cohort vs. those who leave (due to refusal, migration, jail, ...) • Example: In a cohort study of occupation exposures and asthma, the most susceptible individuals may be more likely to leave employment with early symptoms of asthma and the effect of the occupational exposure may be underestimated as a result. • Selection bias is less likely to occur since study participants (exposed or unexposed) are selected (theoretically) before the disease occurs
Selection bias • In case-control studies, selection bias may arise if the cases do not represent either all affected individuals in the population or a representative sample of such individuals. • Selection bias is particularly likely when the cases and controls are selected from patients at a particular institution (hospital or clinic). The selection process may preferentially filter by joint exposure – disease status.
Selection bias • In case-control studies • Example: Consider a hypothetical case-control study of alcoholism and pneumonia among patients admitted to a particular hospital. Alcoholics with pneumonia are more likely to be admitted than non-alcoholics because of concern about compliance with medication on an outpatient biases or more severe disease on presentation to the emergency room or clinic. Compared with the association in the general population, the case-control study would tend to exaggerate the strength of alcoholism as a pneumonia risk factor.
Self-selection bias • Self-referral (from Rothman text) • Eg: Leukemia incidence among troops exposed to atomic testing • 76% of troops identified as members had known outcomes • Of 76%: - 82% were traced, 18% self-referred • 4 cases among the 0.18 [0.18 x 0.76=14%] • 4 cases among the 0.82 [0.82 x 0.76=62%] • total= 8 cases • What is the rate in the 24% of the untraced/ unknown outcome cohort? • 4(24/62)=1.5 cases [plus 8=9-10 cases] or • 8(24/76)= 2.5 cases [plus 8=10=11-12 cases]
Selection bias • Medical surveillance bias: a result of more acute surveillance - resulting in a higher probability of identification of the outcome - this outcome is not independent of knowledge of the exposure • is more likely to occur when the outcome is ascertained by regular medical channels rather than systematically (eg., cohort study)
Selection bias • Medical surveillance bias: a case control study examining the relationship between oral contraceptive (OC) use to diabetes • Because OC use is likely to be related to a higher than average frequency of medical encounters, any subclinical disease is more likely to be diagnosed in these women than others • Result: in a case control study- a spurious association with OC use may occur • The direction of the association is a function of which cell(s) are subjected to a higher or lower probability
The direction of the association is a function of which cell(s) are subjected to a higher or lower probability REFERENCE POPULATION Diseased + - + - Exposed STUDY SAMPLE
Selection bias • Incidence-Prevalence bias: results from the inclusion of prevalent cases into the study • Occurs in cross-sectional studies or at baseline in cohort studies. • When assessing potentially causal associations, the use of the prevalent ‘risk-ratio’ as an estimate of ‘incidence’ • in S&N pages: 157-158
Detecting Selection bias • In cross-sectional studies, there may be no evident clue, other than unexpected patterns of association, e.g., a protective effect of owning a cat for asthma risk. • In cohort studies, the rate of loss to follow-up indicates the potential for selection bias. Comparison of the characteristics of those lost to follow-up with those persons remaining under follow-up, may indicate the potential consequences of any selection bias.
Detecting Selection bias • In case-control studies, the approach to case and control selection signals the potential for selection bias. • Studies based around particular institutions or facilities are particularly likely to be affected (aplastic anemia example).
Example: hypothetical study of aplastic anemia • Cases: identified in a major referent hospital and control are patients with nonmalignant, nonhematologic disorders in the same hospital • Because aplastic anemia patients may be often referred to this hospital for a bone marrow transplant, some of their characteristics may differ from those of other patients: • they may come from large families • they may have health insurance or larger incomes • RESULT: exposures related to these characteristics may be differentially distributed between cases and controls • ----> distorting the exposure/disease association
Controlling selection bias • Choosing both cases and controls with the same magnitude of bias -a compensation effect • eg: a c-c study where both cases and controls are selected from women attending screening program • if cases diagnosed by screening were compared with controls drawn from the general population the association may be overestimated • but - if controls are drawn from the screened population, both groups may be equally likely to have a higher probability of exposure to known risk factors
Sensitivity analysis of selection bias • “Decomposition” or correction of the Odds Ratio: divide the sample OR by a “selection bias” factor • Study must incorporate survey elements to determine (a) the true population frequencies of disease and exposures (if they jointly affect selection) in the source population • Selection bias does not lend itself to quantitative resolution