Sales-Variance Analysis
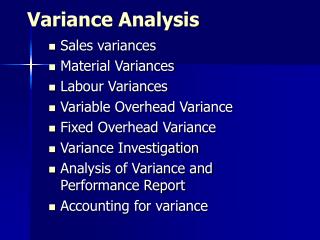
Sales-Variance Analysis. Chapter 14. Calculation of sales variances. Overview of chapter. Calculation of sales variances Interpretation of sales variances. Overview of “Sales” variances. Actual Flexible Static

Sales-Variance Analysis
E N D
Presentation Transcript
Sales-Variance Analysis Chapter 14
Overview of chapter • Calculation of sales variances • Interpretation of sales variances
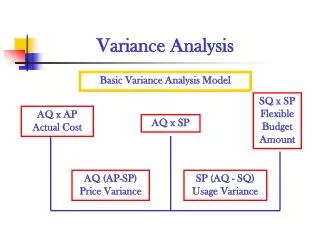
Overview of “Sales” variances Actual Flexible Static Budget Budget |----- Flex. V.-----|-------------- Sales-volume V.---------------| |--- Sales-Mix V.---|----------- Sales-Quant.V.------------| |-- Mkt.-share V. --|-- Mkt.-size V.--| Actual Mkt. size x Actual Mkt. share x Actual sales mix x Actual CM /unit Actual Mkt. size x Actual Mkt. share x Actual sales mix x Budget CM /unit Actual Mkt. size x Actual Mkt. share x Budget sales mix x Budget CM /unit Actual Mkt. size x Budget Mkt. share x Budget sales mix x Budget CM /unit Budget Mkt. size x Budget Mkt. share x Budget sales mix x Budget CM /unit
Things to note: (1) Total number of units of all products sold = market size * market share (2) Number of each product sold = market size * market share * sales mix (3) Average CM / unit = sales mix * CM / unit (4) “Revenue” variances can be calculated by substituting sales price for CM in all of the equations on the prior slide.
Sales-VolumeVariance Components The following information relates to English Languages Institute budget for the year 2003. ProductGrammarTrans.Comp. Selling price per unit $259 $87 $185 Variable cost 189 50 95 Contribution margin per unit $ 70 $37 $ 90
Sales-VolumeVariance Components-budget Product Grammar Translation Composition Cont. margin $70 $37 $90 × Units 3,185 980 735 = Total $222,950 $36,260 $66,150 Sales mix 65% 20% 15% Total budgeted contribution margin = $325,360
Sales-VolumeVariance Components The following are the actual results for English Languages for the year 2003. Product Grammar Translation Composition Selling $/unit $255 $85 $185 Variable cost 180 45 95 Cont. margin per unit $ 75 $40 $ 90
Sales-VolumeVariance Components--actual Product Grammar Translation Composition Cont. margin $75 $40 $90 × Units 2,880 990 630 = Total $216,000 $39,600 $56,700 Sales mix 64% 22% 14% Total actual contribution margin = $312,300
Static-Budget Variance Static- Static- Actual budget budget Productresultsamountvariance Grammar $216,000 $222,950 $ 6,950 U Translation 39,600 36,260 3,340 F Composition 56,700 66,150 9,450 U Total $312,300 $325,360 $13,060 U
Flexible-Budget Variance(actual results “budget”) Actual contribution Unit Actual Productmargin/unitvolumeresults Grammar $75 2,880 $216,000 Translation $40 990 $ 39,600 Composition $90 630 $ 56,700
Flexible-Budget Variance(Flexible budget) Budgeted Actual contribution unit Flexible Productmargin/unitvolumebudget Grammar $70 2,880 $201,600 Translation $37 990 $ 36,630 Composition $90 630 $ 56,700
Flexible-Budget Variance Flexible- Flexible- Actual budget budget Productresultsamountvariance Grammar $216,000 $201,600 $14,400 F Translation $39,600 $ 36,630 $ 2,970 F Composition $56,700 $ 56,700 0 Total flexible-budget variance $17,370 F
Sales-Volume Variance Budgeted contribution ProductActualBudgetmargin Grammar (2,880 – 3,185) × $70 = $21,350 U Translation (990 – 980) × $37 = 370 F Composition (630 – 735) × $90 = 9,450 U Total sales-volume variance $30,430 U
Sales-Mix Variance Sales-mix variance = Actual units of all products sold × (Actual sales-mix percentage – Budgeted sales-mix percentage) × Budgeted contribution margin per unit
Sales-Mix Variance Grammar: 4,500(0.64 – 0.65) × $70 = $3,150 U Translation: 4,500(0.22 – 0.20) × $37 = $3,330 F Composition: 4,500(0.14 – 0.15) × $90 = $4,050 U Total sales-mix variance = $3,870 U
Sales-Quantity Variance Sales-quantity variance = (Actual units of all products sold – Budgeted units of all products sold) × Budgeted sales-mix percentage × Budgeted contribution margin per unit
Sales-Quantity Variance Grammar: (4,500 – 4,900) × 0.65 × $70 = $18,200 U Translation: (4,500 – 4,900) × 0.20 × $37 = $ 2,960 U Composition: (4,500 – 4,900) × 0.15 × $90 = $ 5,400 U Total sales-quantity variance = $26,560 U
Market-Share Variance Example Assume that English Languages Institute derives its total unit sales budget for 2003 from a management estimate of a 20% market share and a total industry sales forecast by Desert Services of 24,500 units in the region. In 2003, Desert Services reported actual industry sales of 28,125 units.
Market-Share Variance Example What is English’s actual market share? 4,500 ÷ 28,125 = 0.16 Budgeted total contribution margin is $325,360. Budgeted number of units is 4,900. What is the budgeted average contribution margin per unit? $325,360 ÷ 4,900 = $66.40
Market-Share Variance Example What is the market-share variance? = Actual market size in units × (Actual market share – Budgeted market share) × Budgeted contribution margin per composite unit for budgeted mix 28,125(0.16 – 0.20) × $66.40 = $74,700 U
Market-Share Variance ExampleAnother way: calculate budgets Actual Market Size ×Actual Market Share × Budgeted Average Contribution Margin Per Unit 28,125 × 0.16 × $66.40 = $298,800 Actual Market Size ×Budgeted Market Share × Budgeted Average Contribution Margin Per Unit 28,125 × 0.20 × $66.40 = $373,500 $373,500 – $298,800 = $74,700 U
Market-Size Variance Example Market-size variance = (Actual market size in units – Budgeted market size in units) × Budgeted market share × Budgeted contribution margin per composite unit for budgeted mix (28,125 – 24,500) × 0.20 × $66.40 = $48,140 F
Market-Size Variance ExampleAnother way: calculate budgets Actual Market Size× Budgeted Market Share × Budgeted Average Contribution Margin Per Unit 28,125 × 0.20 × $66.40 = $373,500 Static Budget: Budgeted Market Size × Budgeted Market Share × Budgeted Average Contribution Margin Per Unit 24,500 × 0.20 × $66.40 = $325,360 $373,500 – $325,360 = $48,140 F
Summary of Variances Level 1 Static-Budget Variance 13,060 U Level 2 Flexible-Budget Variance $17,370 F Sales-Volume Variance $30,430 U
Summary of Variances Level 2 Sales-Volume Variance $30,430 U Level 3 Sales-Mix Variance $3,870 U Sales-Quantity Variance $26,560 U
Summary of Variances Level 3 Sales-Quantity Variance $26,560 U Level 4 Market-Share Variance $74,700 U Market-Size Variance $48,140 F
Another ExampleBOZOtronics(on class webpage)****************End of Chapter 14