Enzyme-Linked Immunosorbent Assay (ELISA)
400 likes | 1.52k Views
Enzyme-Linked Immunosorbent Assay (ELISA). Mary Lea Killian USDA APHIS VS National Veterinary Services Laboratories Ames, Iowa. Enzyme-linked Immunosorbent Assay. http://microvet.arizona.edu/Courses/MIC419/ToolBox/elisa.html. ELISA Kits for Antibody Detection.

Enzyme-Linked Immunosorbent Assay (ELISA)
E N D
Presentation Transcript
Enzyme-Linked Immunosorbent Assay (ELISA) Mary Lea Killian USDA APHIS VS National Veterinary Services Laboratories Ames, Iowa
Enzyme-linked Immunosorbent Assay http://microvet.arizona.edu/Courses/MIC419/ToolBox/elisa.html
ELISA Kits for Antibody Detection • Commercial ELISA test kits are available to detect • Avian influenza virus antibody in chicken serum • Newcastle disease virus antibody in chicken serum • Newcastle disease virus antibody in turkey serum
ELISA Kits for AIV Ab Detection IDEXX SYNBIOTICS
ELISA Results • Results should be recorded by reading the optical densities of the plates in a plate reader at the correct absorbance:IDEXX: 650nm Each manufacturer supplies computer software specific for their test which calculates which samples are negative and the titers of positive samples.
ELISA Results • The status of a sample are evaluated by the sample to positive ratio (S/P ratio): Sample mean - negative control mean positive control mean - negative control mean (mean of optical absorbance) With the IDEXX kit S/P ratios of greater than 0.5 are considered positive
ELISA Results • Example: Sample mean= 0.820 Negative control mean=0.053 Positive control mean=0.563 Values are relatively quantitative: a higher value indicates more antibody.
Valid ranges for the positive and negative controls • Negative control = 0.150 or less • The difference between the positive and negative control means must be greater than 0.075 Example: if negative control = 0.100, the positive control must be 0.176 or greater.
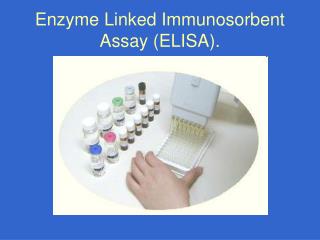
ELISA Laboratory • Materials Needed • AIV ELISA plate • Record Sheet • Test samples (same set as AGID) • Dilution Tubes • Pipets and tips
Materials Needed • The materials for your kit • ELISA plate • Positive control • Negative control • Dilution Buffer (already in dilution tubes) • Conjugate (secondary antibody) • TMB Substrate • Stop solution
ELISA Laboratory 1 • Label dilution tubes • Add 1ml of diluent to dilution tubes (done) • Add 2μl of test serum to a dilution tube • Do NOTdilute controls
ELISA Laboratory 2 • Add 100 µl negative control to wells A1 and A2 • Add 100 µl positivecontrol to wells A3 and A4
Add 100μl of diluted test serum to the plate according to your record sheet • Incubate for 30 minutes
ELISA Laboratory 3 • Wash with 350 μl distilled water (three times) • Add 100 μl of conjugate to test wells on your plate • Incubate for 30 minutes
ELISA Laboratory 4 • Wash with distilled water (3 times) • Add 100 μl of TMB substrate to each well • Incubate for 15 minutes • Add 100 μl of stop solution to each well • Read results
Interpretation of Results Negative control = 0.150 or less The difference between the positive and negative control means must be greater than 0.075 Example: if negative control mean = 0.100, the positive control mean must be 0.176 or greater
Calculation of Results • Average the 2 negative control wells • Average the 2 positive control wells • Average 2 wells for each sample
Calculation of Results • Example: Sample mean= 0.820 Negative control mean=0.053 Positive control mean=0.563 S/P ratios of greater than 0.5 are considered positive (Positive values will be different for each kit)
![Enzyme-Linked Immunosorbent Assay [ ELISA ]](https://cdn1.slideserve.com/2423074/enzyme-linked-immunosorbent-assay-elisa-dt.jpg)