Download

1 / 42
420 likes | 644 Views
Commercial Bank Behavior. Is Banking Becoming More Competitive?. Recent Bank Mergers. 1990 : ABN and AMRO ($218 billion) 1996 : Chemical Bank and Chase Manhattan ($297 billion) 1996 : Mitsubishi Bank and Bank of Tokyo ($752 billion)

E N D
Commercial Bank Behavior Is Banking Becoming More Competitive?
Recent Bank Mergers 1990: ABN and AMRO ($218 billion) 1996: Chemical Bank and Chase Manhattan ($297 billion) 1996: Mitsubishi Bank and Bank of Tokyo ($752 billion) 1997: Union Bank of Switzerland and Swiss Bank ($595 billion) 1997: NationsBank and Barnett ($310 billion) 1998: Royal Bank and Bank of Montreal ($330 billion) 1998: Toronto Dominion and CIBC ($320 billion) 1998: NationsBank and BankAmerica ($570 billion) 1998: Banc One and First Chicago NBD ($240 billion) 1998: Citicorp and Traveler’s ($700 billion) 2003: Bank of America and Fleet ($851billion) 2003: JP Morgan and Bank One ($1trillion) The last 20 years has seen considerable consolidation in the banking industry…
Consolidation has created a market where a small group of large banks controls a majority of total assets
The 10 largest banks in the US control around 40% of all banking assets
Concentration Ratios The concentration ratio is the percentage of market share owned by the largest m firms in the industry (usually 4, 8, 20, 50)
However while the US is the world’s largest economy, only three of the ten largest banks in the world are American.
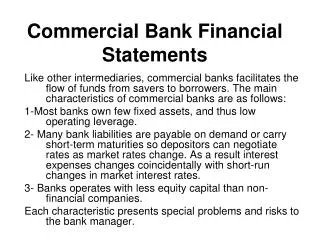
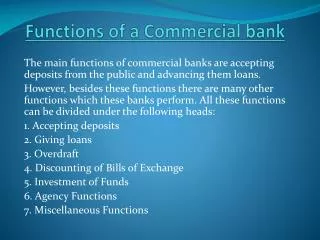
The banker’s optimization problem has three dimensions… As a financial intermediary, a bank must solve the informational problems that exist between borrowers and lenders (moral hazard and adverse selection) As a portfolio manager, a bank must choose a portfolio composition to minimize risk As a competitive firm, the bank must choose prices (interest rates) to maximize profits)
As a financial intermediary, a bank must solve the informational problems that exist between borrowers and lenders (moral hazard and adverse selection) Most of the informational problems that exist between the bank and potential depositors have been solved through regulation and insurance (FDIC), but the bank must still deal with the moral hazard and adverse selection problems associated with its loan customers • Diversification • Loan Covenants • Credit Rationing (Credit Limits) • Credit Scoring
Credit scoring is an attempt to estimate loan default rates based on observable characteristics. The most common credit score was developed by Fair/Isaac Co. and is known as your FICO number (300 – 850) Key Components of FICO Score These are NOT in a FICO Score • How you pay your bills (35%) • Amount of Debt/Amount of Available Credit (30%) • Length of Credit History (15%) • Mix of Credit (Types of Loans) (10%) • Applications for new credit (10%) • Age • Race • Employment • Income • Education • Marital Status To estimate your FICO score, click here
As a competitive firm, the bank must choose prices (interest rates) to maximize profits) A bank makes its profits from the spread between the interest rate it charges on loans and the interest rate it pays on deposits (Interest rate on loans) (Quantity of loans) – (Quantity of Deposits) (Interest paid on deposits) Profits Note: This is ignoring income from fees!
Acme National Bank Assets Liabilities $5,000 (Cash) - 0% $100,000 (Checking) - 0% Profits equal revenues minus costs $10,000 (Reserves) - 0% $100,000 (Savings) - 2% $50,000 (T-Bills) - 4% $100,000 (1 yr. CD) - 3% $100,000(5 yr. Loans) – 5% $65,000 (5 yr. CD) – 4% $300,000 (30 yr Mort.) – 7% Assets – Liabilities = $100,000 (Equity) Profit = .04 ($50,000) + .05 ($100,000) + .07($300,000) = $28,000 - .02($100,000) + .03($100,000) + .04 ($65,000) = $ 7,600 $20,400 However, profits don’t take into account the scale of operations (How large is the bank?)
Acme National Bank Assets Liabilities $5,000 (Cash) - 0% $100,000 (Checking) - 0% $10,000 (Reserves) - 0% $100,000 (Savings) - 2% Profit = $20,400 $50,000 (T-Bills) - 4% $100,000 (1 yr. CD) - 3% $100,000(5 yr. Loans) – 5% $65,000 (5 yr. CD) – 4% $300,000 (30 yr Mort.) – 7% Total Assets = $465,000 Assets – Liabilities = $100,000 (Equity) After Tax Profits $20,400 Return on Assets (ROA) = = = .044 (4.4%) Total Assets $465,000 After Tax Profits $20,400 Return on Equity (ROE) = = = .20 (20%) Equity $100,000
Company A Assets = 100 Profits = 10 Debt = 20 Equity = 80_________ ROA = 10% ROE = 12.5% Company B Assets = 100 Profits = 10 Debt = 80 Equity = 20_________ ROA = 10% ROE = 50% ROE vs. ROA The more leveraged a firm is, the higher the return to equity for a given ROA. However, a highly leveraged firm carries more risk!
Acme National Bank Assets Liabilities $5,000 (Cash) $100,000 (Checking) $10,000 (Reserves) $100,000 (Savings) $50,000 (T-Bills) $100,000 (1 yr. CD) $100,000(5 yr. Loans) $65,000 (5 yr. CD) $300,000 (30 yr Mort.) Total Assets = $465,000 Assets – Liabilities = $100,000 (Equity) A Bank also faces two constraints: Federal Reserve Cash + Reserves = (Reserve Requirement) (Checkable Deposits) = (.05)($100,000) = $5,000 Basel Accord Equity = (.04)(Assets) = (.04)($465,000) = $18,600
Lets assume that you have the only bank in town. You offer one type of loan – a 30 year $100,000 fixed APR mortgage. You offer savings accounts that pay 3% interest per year.
You have monthly fixed costs equal to $20,000. Further, you have annual administrative costs equal to 1% of your total funds raised. Let Q = Total Number of Loans .03 .01 Total Monthly Costs $20,000 + $100,000 Q + $100,000 Q 12 12 Fixed Cost Interest Cost Administrative Costs For example, if you want to create 3 mortgages, you will need to raise $300,000 in deposits that will earn $9,000 per year (3% of $300,000) and incur $3,000 (1% of $300,000) in administrative expenses. Total Monthly Cost = $20,000 + $750 + $250 = $21,000
Let Q = Total Number of Loans .04 Total Monthly Costs = $20,000 + $100,000 Q 12 Fixed Costs Variable Costs Cost Slope = $333.33 $21,000 $20,000 # of Loans 3
You have estimated the demand for mortgages to be as follows: Q = 155.0 - 624 ( r ) – 90.4 ( UR ) Unemployment Rate Interest Rate Charged For example, if you set your mortgage rate at 6% (.06) and the local unemployment rate is 5% (.05), you will be able to sell 113 mortgages Q = 155.0 - 624 (.06) – 90.4 (.05) = 113 Your total annual revenues would be $100,000 (113)(.06) = $678,000
Q = 115.0 - 624 ( r ) – 90.4 ( UR ) (Demand) OR Interest Rate 115 1 90.4 - - r = Q UR (Inverse Demand) 624 624 624 6% UR = 5% # of Loans 113 155 1 90.4 - - r = (113) (.05) = .06 624 624 624
Q = 155.0 - 624 ( r ) – 90.4 ( UR ) Interest Rate 6% UR = 5% # of Loans 113 Elasticity of Demand refers to the responsiveness of demand to price changes (here, the price is the interest rate)
Revenue Maximization…. 2 Total Revenues = Q($100,000)r = $100,000 155 r - 642 r - 90.4(UR) r Q = 155 - 624 ( r ) – 90.4 ( UR ) Maximizing Total Revenues involves taking the derivative with respect to the interest rate and setting it equal to zero… 155 - 2 (624) r - 90.4(UR) = 0 Solving for r … 155 – 90.4(UR) r = 2(624)
If the unemployment rate is equal to 5%, the revenue maximizing loan rate is 12.05% 155 – 90.4(.05) = .1205 r = 2(624) Revenues = $100,000 (75)(.1205) = $903,750 12.05% Total Revenues UR = 5% # of Loans 75 = 155 - 624 ( .1205 ) – 90.4 (.05 )
Profit Maximization… r Total Revenues = Q ($100,000) 12 (Monthly) 155 1 90.4 - - r = Q UR 624 624 624 2 Total Monthly Revenues $100,000 $100,000 1 $100,000 90.4 155 - - = Q Q UR Q 12 12 624 12 624 624 2 Total Monthly Revenues $24,840 - $14,487 UR 160 - = Q Q 12 12
Profit Maximization… 2 Total Monthly Revenues - = $2,070 - $1,207 UR Q 13.3 Q Marginal Revenue is the derivative of Total Revenue with respect to Q $ Marginal Revenues - = $2,070 - $1,207 UR 26.6 Q $100,000*Demand MR Quantity
Profit Maximization… .04 Total Monthly Costs = $20,000 + $100,000 Q 12 Marginal Cost is the derivative of Total Cost with respect to Q $ Total Costs Marginal Costs = $333.33 Quantity
Profit Maximization… Profits = Total Revenues – Total Costs Maximization Condition Marginal Revenues = Marginal Costs - $2,070 - $1,207 UR 26.6 Q = $333.33 UR = .05 Solving for Q Q = 63 155 1 90.4 - - r = Q UR = .1412 (14. 12%) 624 624 624
Profits = Total Revenues – Total Costs Total Monthly Revenues = $100,000(63)(.1412)/12 = $74,130 .04 Total Monthly Costs = $20,000 + $100,000 63 = $41,000 $ - 12 Profits = $33,130 Annual Profit = $397,560 14.1% MC $100,000*Demand MR Quantity 63
Elasticity of Demand refers to the responsiveness of demand to price changes – as number of banks increases, demand becomes more elastic Interest Rate More elastic Less elastic Q This number gets bigger! Q = 155 - 624 ( r ) – 90.4 ( UR )
As Demand Becomes more elastic… • The Spread between price (interest rate) and costs decreases • Quantity increases • Profits decrease Interest Rate r MC Demand MR Q Q This number gets bigger! Q = 155 - 624 ( r ) – 90.4 ( UR )
As long as there are profits to be made, more banks enter the area. Eventually, price = marginal costs and profits drop to zero.
As a portfolio manager, a bank must choose a portfolio composition to minimize risk Acme National Bank Assets Liabilities $5,000 (Cash) $100,000 (Checking) $10,000 (Reserves) $100,000 (Savings) $50,000 (T-Bills) $100,000 (1 yr. CD) $100,000(5 yr. Loans) $65,000 (5 yr. CD) $300,000 (30 yr Mort.) Assets – Liabilities = $100,000 (Equity) = 21.5% of Assets Suppose that the yield curve shifts up by 100 basis points:
Acme National Bank Durations are indicated in parentheses Assets Liabilities $5,000 (Cash) (0) $100,000 (Checking) (0) $10,000 (Reserves) (0) $100,000 (Savings) (0) $50,000 (T-Bills) (1) $100,000 (1 yr. CD) (1) $100,000(5 yr. Loans) (3) $65,000 (5 yr. CD) (5) $300,000 (30 yr Mort.) (15) Assets – Liabilities = $100,000 (Equity) = 21.5% of Assets $50,000 $100,000 $300,000 Duration (Assets) = 1 + 3 + 15 =10.4 $465,000 $465,000 $465,000 $100,000 $65,000 Duration (Liabilities) = 1 + 5 = 1.16 $365,000 $365,000
Acme National Bank Assets Liabilities $5,000 (Cash) (0) $100,000 (Checking) (0) $10,000 (Reserves) (0) $100,000 (Savings) (0) $50,000 (T-Bills) (1) $100,000 (1 yr. CD) (1) $100,000(5 yr. Loans) (3) $65,000 (5 yr. CD) (5) $300,000 (30 yr Mort.) (15) Assets – Liabilities = $100,000 (Equity) = 21.5% of Assets Liabilities Duration Gap = Duration (Assets) – Duration (Liabilities) Assets $365,000 = 10.4 – 1.16 = 9.5 $465,000
Acme National Bank Assets Liabilities $5,000 (Cash) (0) $100,000 (Checking) (0) $10,000 (Reserves) (0) $100,000 (Savings) (0) $50,000 (T-Bills) (1) $100,000 (1 yr. CD) (1) $100,000(5 yr. Loans) (3) $65,000 (5 yr. CD) (5) $300,000 (30 yr Mort.) (15) Duration Gap = 9.5 Assets – Liabilities = $100,000 (Equity) = 21.5% of Assets For every 100 basis point increase in the yield curve, this bank’s equity (as a percentage of assets) drops by 9.5% How much of an interest rate change can this bank withstand before it inadequately capitalized?