Download
1 / 8
90 likes | 595 Views
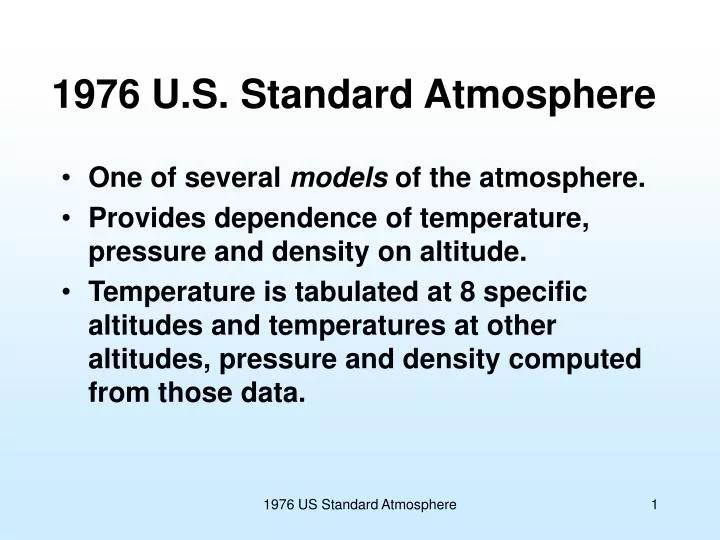
1976 U.S. Standard Atmosphere. One of several models of the atmosphere. Provides dependence of temperature, pressure and density on altitude. Temperature is tabulated at 8 specific altitudes and temperatures at other altitudes, pressure and density computed from those data. . P 1.

E N D
1976 U.S. Standard Atmosphere • One of several models of the atmosphere. • Provides dependence of temperature, pressure and density on altitude. • Temperature is tabulated at 8 specific altitudes and temperatures at other altitudes, pressure and density computed from those data. 1976 US Standard Atmosphere
P1 For Incompressible Fluid (like Water) P [Pascal = N/m2] The difference in pressure at the two depth is due to the weight of the column of water between them. Known as “hydrostatic equation” z 1976 US Standard Atmosphere
Atmosphere – Compressible Fluid First consider an isothermal (constant temperature) atmosphere and assume a perfect gas: (Perfect gas) Rearrange: Apply limits: 1976 US Standard Atmosphere
Atmosphere – Compressible Fluid So for isothermal (constant temperature) atmosphere: Note exponential drop of pressure with altitude, vs. linear with depth in an incompressible fluid like water. i.e., express pressure at one point in terms of that at a different altitude You can also handle (integrate) the case where the temperature is a linear function of altitude (constant “lapse rate”).* These are the two options in the VBA coding that goes with the USStandAtmos.xls spreadsheet on webpage (www.people.virginia.edu/~rjr/modules/xls) *See, e.g., D.G. Shepherd, Elements of Fluid Mechanics, Harcourt, Brace and World, 1965.
Red circles indicate the limits of the 7 layers. Intermediate values are computed from them. 1976 US Standard Atmosphere
U.S. Standard Atmosphere 1976 • Seven layers between sea level and ~85 km • Decrease of “g” with altitude is included in the calculation by use of “geopotential” altitude. • h = Altitude * Rearth / (Altitude + Rearth) • Two layers are isothermal • Five layers have constant “lapse rate” (dT/dz) • Pressure tabulated at base of each layer and change computed between there and the point of interest. • Use equation we just derived for isothermal layer, similar equation for constant lapse rate layers. • Density found from P and T and perfect gas law. 1976 US Standard Atmosphere
Dependence of Density and Pressure On Altitude. • Handy numbers to remember: • Density of air at sea level [kg/m3], • Pressure at sea level [kPa], • Depth of troposphere [km]. 1976 US Standard Atmosphere
Other notes: • Most sunlight comes through atmosphere (it’s largely transparent), hits surface of earth and the air in contact is heated up. That’s why the peak air temperature is at surface. • The other temperature peak at ~50 km is due to absorption of UV rays by ozone (and there isn’t much atmosphere there to heat up). 1976 US Standard Atmosphere