Download
1 / 22
220 likes | 459 Views
The Kansas Budget: A Simple Overview. Timid men prefer the calm of despotism to the tempestuous sea of liberty. -Thomas Jefferson . 1. Significant Points in the Budget Cycle . 2. Where does the money come from?. Total Revenue: $5,393.5. Total may not add due to rounding. 3.

E N D
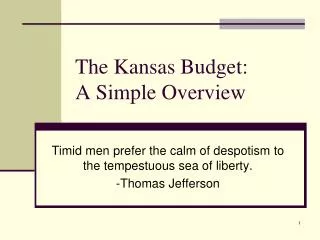
The Kansas Budget:A Simple Overview Timid men prefer the calm of despotism to the tempestuous sea of liberty. -Thomas Jefferson 1
Where does the money come from? Total Revenue: $5,393.5 Total may not add due to rounding 3
Where does a dollar come from? FY 2010 Estimated State General Fund Individual Income Tax 48¢ Sales and Compensating Use Tax 36¢ Corporate & Financial Income Tax 5¢ Tobacco Taxes 2¢ Insurance Premium Tax 2¢ Severance Tax 2¢ Alcohol Taxes 1¢ Estate/Succession Tax 1¢ Other Taxes 3¢ Total Receipts $1.00 (Note: Property Tax is not included) 4
Where does the money go? FY05 FY06 FY07 FY08 FY09 Transportation $0 $0 $0 $16.1M $16.1M(roughly 0%) Public Safety $329.9M $370.4M $384.0M $415.4M $416.7M(roughly 7%) Ag & Natural $26.3M $27.6M $37.2M $36.8M $33.5M Resources(roughly 1%) General Gov’t. $181.1M $201.8M $222.6M $254.9M $265.1M(roughly 4%) Human Svcs. $1,098.1B $1,173.0B $1,139.8B $1,444.6B $1,358.5B(roughly 23%) Education $3.054.7B $3,366.7B $3,639.1B $3,934.0B $3,974.4B(roughly 65%)---------------------------------------------------------------------------------------------------------------------------------------------------------------------------------------------------- TOTAL SGF $4,690.1B$5,139.4B $5,607.7B $6,101.8B $6,064.4B(rounded)
Where does the money go? Total Expenditures: $5,450.1 Total may not add due to rounding 7
Where does a dollar go? FY 2010 Approved State General Fund Expenditures Department of Education 52¢ Board of Regents and Institutions 14¢ Other Education 1¢ Subtotal Education 67¢ Dept. of SRS (including Hospitals) 10¢ Health Policy Authority 7¢ Dept. of Corrections and Facilities 4¢ Dept. on Aging 3¢ Judicial, Board of Indigents’ Defense 2¢ Juvenile Justice Authority and Facilities 1¢ All Other 6¢ Total Receipts $1.00 8
Where are we going? RECEIPTS Through January FY 2010 $39.1 Million below projection Through February FY 2010 $71 Million below projection = ~ $100 Million deficit for FY 2010= ~ $500 Million deficit for FY 2011 According to KS DOL & Labor Market Info Services…Since 2001, Local and State Government employment has trended upward (+10% or 21,016 positions created), while jobs have been lost in the private sector (-1% or 10,937 – through Q2 of 2009 only). More than $700M paid out in unemployment, with limited slowing, a depleated UI fund and an impending federal loan. And according to the KS DOR, FY 2009 Corporate income tax receipts fell drastically (-44.4%) below FY 2008 receipts.
Where does the money go? Total Expenditures: $5,450.1 Total may not add due to rounding 15
How is K-12 funding derived? The current school finance formula is built upon what is referred to as the BSAPP, or the BASE STATE AID PER PUPIL (currently $4012)
PLUS Various Weightings - Low enrollment (districts with fewer than 1662 students) - High enrollment (more than 1662) - Bilingual Education - Declining Enrollment - Transportation - At Risk - Etc.
Effect of BSAPP combined w/ WEIGHTINGS (e.g. Small, Medium and Large School District) 18