Download

1 / 34
500 likes | 1.75k Views
Observational Research. Psyc 301: Week 2. AGENDA. Quick Review Homework Discussion Observational Research Class Activity Homework. Phases of Research. Idea generation Defining the Problem Design the Procedures Observe/Collect Data Data-Analysis Interpret the data

E N D
Observational Research Psyc 301: Week 2
AGENDA • Quick Review • Homework Discussion • Observational Research • Class Activity • Homework
Phases of Research • Idea generation • Defining the Problem • Design the Procedures • Observe/Collect Data • Data-Analysis • Interpret the data • Communicate the findings
The Basics of Research Design • Psychological research is about answering questions • But where do the questions come from? • Established Theories • Past Research • Scientific Hunches
The Basics Continued • Variable • A characteristic that changes or has different values for different individuals • What are some variables in this room? • Student height • Individual anxiety level • Room temperature
Two Types of Variables • Independent Variable (IV) • Variable that is changed or manipulated • Dependent Variable (DV) • Variable that is used to measure the change or affect of the IV • Example: • Fertilizers and Corn Crops • What is the IV? • What would be the DV(s)?
Hypothesis • Makes a prediction about how the manipulation of the IV will affect the DV OR… • Makes a prediction about the relationship between two variables • i.e, Correlational studies • “Fertilizer and corn” hypotheses?
Scientific Writing and Reporting • APA Style: • What is it? • APA style refers to rules and guidelines for publishing psychological research • Types of articles: • Review articles (summarize and/or critique past research) • Case studies (author’s description of case material about a specific individual or organization) • Empirical studies (reports of original research)
APA Style • Four Main Sections: • Introduction (Literature Review) • Methodology • Results • Discussion (Conclusion)
Pennebaker Article Discussion • What were the different sections of this article? • Which phase(s) of research were addressed by which section(s)? • How does the author catch the readers interest in the introduction? • What was the purpose of this study? Where do we find it? • Which theory leads to the research question addressed in this study? • What is the IV? The DV?
An Overview of Research Designs • Naturalistic Observation • Observation only, no interaction • Ex) Studying animal behavior • Case-Study • In-depth study of 1 easily available instance (e.g., Piaget’s records of his children) • Correlational Research • Explores the relationships between variables • Causality?
An Overview of Research Designs • Differential Research • Using Pre-existing variables (i.e., Gender) to define groups • Experimental Research • Assignment to conditions • Manipulation of variables to establish causality • Independent Variable with multiple levels • Ex) Cell Phones and Driving Research
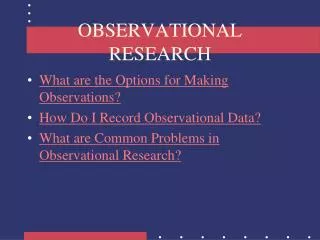
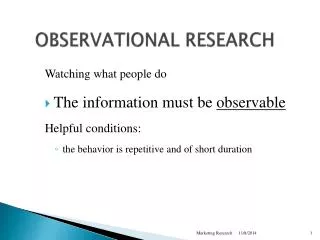
Observational Research • Scientific observation is made under precisely defined conditions, in a systematic and objective manner, and with careful record keeping.
Observation classification • Without intervention: “naturalistic observation” • Observer = passive recorder • Natural setting: A place where behavior would occur normally • With Intervention: “tampering” • Participant observation • Structured observation • Field Study
What are the pros and cons to each? • Observation without intervention? • Observation with intervention?
What are some examples of observational research? • Simons and Levin (1998) studying Change Blindness • http://viscog.beckman.uiuc.edu/grafs/demos/12.html • Messer and Gross (1995) studying family interactions of children diagnosed with depression • Messer, S.C., and A.M. Gross (1995) Childhood depression and family interaction: a naturalistic observation study. Journal of Clinical Child Psychology, 24,
How do we measure and record observed behavior? • Operational definitions: • WHAT concept are you studying, HOW are you going to measure it. • Ex.: If intelligence is the concept we want to measure, we may use any number of things to measure it. • Ways to record behavior: • Qualitative • Written descriptions, audio tapes, video tapes • Quantitative • Frequency of the behavior, measuring the duration of the behavior
Observer Reliability • Inter-observer reliability: the degree to which 2 independent observers agree • How do we ensure inter-observer reliability? • Clear definitions (behaviors/events) • Training observers • Feedback about discrepancies • Reliability: Number of times 2 observers agree Number of opportunities to agree X 100
Descriptive Statistics • Statistics that describe the data • Measures of Central Tendency • Frequencies • Tables/Charts/Graphs
Measures of central tendency • MODE – the number that occurs the most • e.g., 1, 6, 8, 7, 6, 2, 9, 1, 6 • Mode = 6 • MEDIAN – The number that represents the 50th percentile (the middle number or an average of the 2 middle numbers) • e.g., 1, 3, 7, 8, 14, 35, 99, • Median = 8 • e.g., 1, 3, 6, 8, 55, 75 • Median = ? • MEAN – what we think of as “average” • ∑(X)/N • e.g., 1, 5, 7, 3 …..thus (1+5+7+3)/4 • mean = 4 • e.g., 2, 7, 5, 66 • mean = ?
Example: Observation w/ intervention“Helping Behavior” • A group of researchers decide to measure helping behavior on college campuses. • They have either a male or a female confederate walk out of the Johnson Center in front of one or more students. The confederate then “accidentally” drops a brightly colored computer disk onto the brick walk. • Three observers record how many times another student exhibits helping behavior toward the confederate. • Operational definition of helping behavior • Point out to the confederate that (s)he has dropped the disk (Informatively Helpful) • Pick up the disk and return it to the confederate (Actively Helpful)
Frequencies Table Example Table 1 Observed helping behaviors as a function of Gender
Creating a Table APA Style • Refer to Dunn, 2004 pg 152 Table 8.1 for formatting • Items to remember: • Title for your table (brief but understandable) • Label your columns and rows meaningfully • Those silly lines within the table that APA uses • Double check your table values for accuracy
Now, It’s YOUR Turn! • In-class assignment: get into groups of 3-4 and complete proposed study design worksheet (Note: I must approve your study!) • HOMEWORK: • Groups of 3 or 4 • Conduct observational study with 20-30* observations • Can be with or without intervention • Must observe in 2 or more settings (I.e., David King and SUB 2) OR 2 or more times (I.e., morning vs. night) • Write summary of data, including: • List of variables • Operational definitions • Means and frequencies • Try creating a table for your data • Either frequencies, means or both!! • Bring your data (printed out spreadsheet, email yourself, or on disk) to class next time
Turn In Next Time • In-class worksheet stapled to your written data summary • Data Summary Must Include: 1. What concept you measured 2. The definition of what you measured, how you operationally defined it and how you recorded it 3. The population or sample that you observed 4. The different times and settings of your observational study 5. Describe your data/Interpreting the statistics • i.e., 20% of the people left the bench when the experimenter sat close to them..etc. • Descriptive Statistics (Mean, Median, and Mode) of your data on a separate sheet or in a table • Try displaying them in a table • Use excel if you have a big data set
Questions? • Refer to Chapter 4 of Shaughnessy et al. • Loooooooooooots of detail! • Email me • Office hours?