Download
1 / 36
360 likes | 624 Views
Future abrupt reductions in summer Arctic sea ice - CCSM 3.0 Marika M Holland Cecilia M Bitz Bruno Tremblay. Community Climate System Model Version 3.0. Coupling: Atmosphere, Land, Ice & Ocean http://www.ccsm.ucar.edu /models/ccsm3.0/. Community Atmosphere Model - CAM3.

E N D
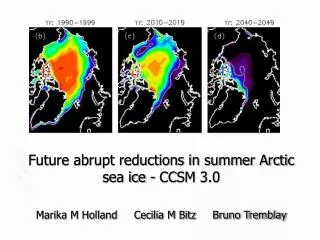
Future abrupt reductions in summer Arctic sea ice - CCSM 3.0 Marika M Holland Cecilia M Bitz Bruno Tremblay
Community Climate System Model Version 3.0 Coupling: Atmosphere, Land, Ice & Ocean http://www.ccsm.ucar.edu /models/ccsm3.0/
Community Atmosphere Model - CAM3 • T85: 1.4 degree resolution • 26 vertical levels • Anthropogenic GHG scenarios : A1, A2, B1, B2
Future Emission Scenarios • A1 : future world very rapid economic growth, global population peaks in mid-century and declines thereafter, rapid introduction efficient technologies. • A2 : self-reliance and preservation of local identities, continuously increasing global population, economic growth and technological changes are slower • B1 : same global population as A1, but with rapid changes toward service & information economy, with reductions in material intensity, clean & resource-efficient technologies.
Community Land Model: CLM 3.0 • Subgrid mosaic of plant functional and land cover types taken from satellite observation • Same grid as atmosphere except for river routing. Uses 0.5 degree grid.
Parallel Ocean Program • Isopycnal transport parameterization with vertical mixing. Isopycnal: surface of constant water density • 1 degree resolution with North Pole displaced into Greenland to avoid converging meridians in Arctic Basins
Community Sea Ice Model: CSIM 5.0 • Identical Greenland Pole grid as Parallel Ocean Program • 5 Ice Thickness & 1 Open Water category • Energy Conserving Thermodynamics • Elastic-viscous-plastic rheology • Subgrid scale ice thickness distribution • Thickness Evolution • Rafting & ridging distribution • Ice Strength energetics • Albedo parameterization with implicit melt ponds
Ice Balance - Governing Equations Wind & Ocean Shear Stress 2D Sea Ice Motion 2D Continuity Eq. Height & Concentration Thermodynamic Source Terms Conservation Energy - T Atm., Ocean & Land Atmosphere-Ice Heat transfer
Ice Rheology Ice Behaviour Elastic Solid Plastic Solid Fluid
IPCC-AR4 Contribution • Intergovernmental Panel on Climate Change 4th assessment report • All model runs include integrations through 1870-1999 forced with changes in sulfates, solar input, volcanoes, ozone, GHG’s, halocrabons, black carbon from observed record & offline chemical transport models. • Simulations during 21st century used Special Report on Emission Scenarios (SRES) A1B scenario.
Observed Arctic Sea Ice Retreat Right animation: The minimum concentration of Arctic sea ice in 2005 occurred on September 21, 2005, when the sea ice extent dropped to 2.05 million sq. miles, the lowest extent yet recorded in the satellite record. The yellow line represents the average location of the ice edge of the perennial sea ice cover for the years 1979 through 2004. Click on image to view animation.Credit: NASA
Ensemble Member 1 Predictions Abrupt reductions with retreat 3 times faster then observed (1979-2005) trends 20 % loss from 1998 – 2003 Decrease of ~ 4 million km2 /year in 10 years 2024 – 2040 rapid retreat with nearly ice free conditions by 2040 Ice retreat accelerates with increased Open Water Production Efficiency & ice-albedo feedbacks
Definition of Abrupt Transition • Derivative 5-year running mean smoothed September ice extent > -0.5 M km2 /year 7 % loss of 2000 ensemble mean • Event length determined at transition when smoothed timeseries exceeds a loss 0.15 km2/year
Abrupt Transitions • Mechanisms & Prediction Thermodynamics – Ocean & Atmospheric heat transport during melt season; May through August Vs. Dynamics – Divergence & Deformation
Thinning Arctic Ice Pack • Future simulations of thinning Ice linked to Abrupt Transitions in ice coverage Rate & Magnitude of thinning ice comparable to past trends with little ice extent change. Why? • Trend is NON-LINEAR Melt Season Open Water Production Efficiency = % open water formation per cm of ice melt • A given melt rate has more influence on minimum summer ice extent as the ice gets thinner due to accelerated Open Water Formation
Critical Ice Thickness ? • Link between thickness and Rate of OWF suggests Critical Point = Total potential Summer Melt • 7 ensemble members provide no evidence Simulated natural variability & forced change “contaminate” an identifiable critical ice thickness • Recent changes suggest the Arctic has reached a “tipping point” with strong + feedbacks
Arctic Radiation Balance • Increased OWF reduces the Arctic Albedo Ocean absorbs more SWR. Greater basal ice melt rate and delayed autumn growth. • Increased fresh water flux through Canadian Archipelago & Fram Strait reduces MOC in North Atlantic.
Artic Ocean Heat Transport • Strengthened ocean currents & southern warm water enter Arctic increasing OHT despite weakening MOC in North Atlantic south of Denmark Strait. WHY? Weaker insulation of thinner ice cover causes larger ice production, brine rejection and ocean ventilation Abrupt increases in OHT modifies summer Ice growth/melt rates + feedback accelerating the ice retreat. T / Z = -Qo / Ki
Arctic Sea Ice Animation Left animation: Arctic sea ice typically reaches its minimum in September, at the end of the summer melt season, and then recover over the winter. The 2004-2005 winter-season showed a smaller recovery of sea ice extent than any previous winter in the satellite record, and the earliest onset of melt throughout the Arctic. This visualization shows seasonal fluctuations in Arctic sea ice derived from the new high resolution AMSR-E instrument on NASA's Aqua satellite. Click on image to view animation.Credit: NASA Right animation: Sea ice decline is likely to affect future temperatures in the region. Because of its light appearance, ice reflects much of the sun's radiation back into space whereas dark ocean water absorbs more of the sun's energy. As ice melts, more exposed ocean water changes the Earth's albedo, or fraction of energy reflected away from the planet. This leads to increased absorption of energy that further warms the planet in what is called ice-albedo feedback. Click on image to view animation.Credit: NASA
Biases in a Simulated Arctic? • Does the modeled Atlantic heat flux compare well with observed record? • How unique is the abrupt September ice transition in Ensemble Run 1? • How robust are the processes involved in the transition?
Observed vs. Simulated OHT • 20th century observations show a warming of the intermediate (150-900m) depth Atlantic layer within the Arctic Ocean. (Gradual superimposed with pulse-like events) • Similar trend produced in simulations supporting the Model results
Ensemble Member Model Runs • from 7 ensemble members Model runs compare well with observations Abrupt Transitions are a Common Feature 4 X faster then that observed between 1979-2005 Minimum 2.6 time faster. ~ -0.4 M km2/year All abrupt transitions are thermodynamically driven
Additional Archived Models • 6 / 15 IPCC-AR4 model archives with A1B scenarios have abrupt transitions. • (SRES B1) slower anthropogenic GHG rate 3/ 15 have abrupt transitions • (SRES A2) greater anthropogenic GHG rate 7/ 11 exhibit abrupt retreat with larger rates of change
The Reality of Abrupt Change • Simulations warn that they will become common events in the future • Changes in human GHG emissions policies could help reduce the risk • Earliest event approximated in 2015 ~ 2.5 M km2 lost in 5 years
Consequences - Precipitation • Increase in summer evaporation causing greater cloudiness and sea-smoke. • Greater summer precipitation over circumpolar lands • Increased Mountain Glaciations • Increased run-off over thawing Canadian tundra Great turbidity in costal waters Sediment loading in Arctic rivers and basin
Consequences – Atmospheric Dynamics • Possible northward shift of the Jet Stream • Change in local pressure intensities • Weaker Polar Highs (Weaker Polar Easterlies) • Deeper Stronger lows • Frictional coupling of ice ate air/sea interface reduced forcing new patterns of arctic circulation Sea surface roughness will increase costal erosion
Consequences – Social & Economic • Adaptation to climate change by native peoples in Canadian Territories Strain on social behavior and subsidence strategies • Improved ice conditions will will increase shipping through the arctic for a longer season. • Through passages Europe-Pacific • Supply Routes into Arctic communities
International Polar Year 2007-2008 • International effort to better understand Polar environments and climate • Canadian Proposal Themes • Indigenous & Western Knowledge Traditions • Contaminants in Polar Environment & Human Systems • Arctic Archipelago Throughflow • Environmental Genomics & Renewable Resources • Earth Atmosphere Ocean Exchanges • Earth Observation (RADSAT 2 March 2007)
IPY Proposal • Measurements & modeling of delta O18 and Lead-210 vertical profiles (internal temperature and salinity) Study heat & brine fluxes through sea ice to better understand ice growth & melt dynamics • The search for the Franklin expedition: a new perspective based on Inuit oral tradition