Download

1 / 19
190 likes | 319 Views
https://www.youtube.com/watch?v=gmj_w_yAVzU<br>Jinfonet.com<br>Follow us on Twitter! twitter.com/Jinfonet<br>http://www.jinfonet.com/solutions

E N D
Design Decisions for Embedding BI into Your Application Dean Yao Director of Marketing Mike Poplawski Systems Engineer
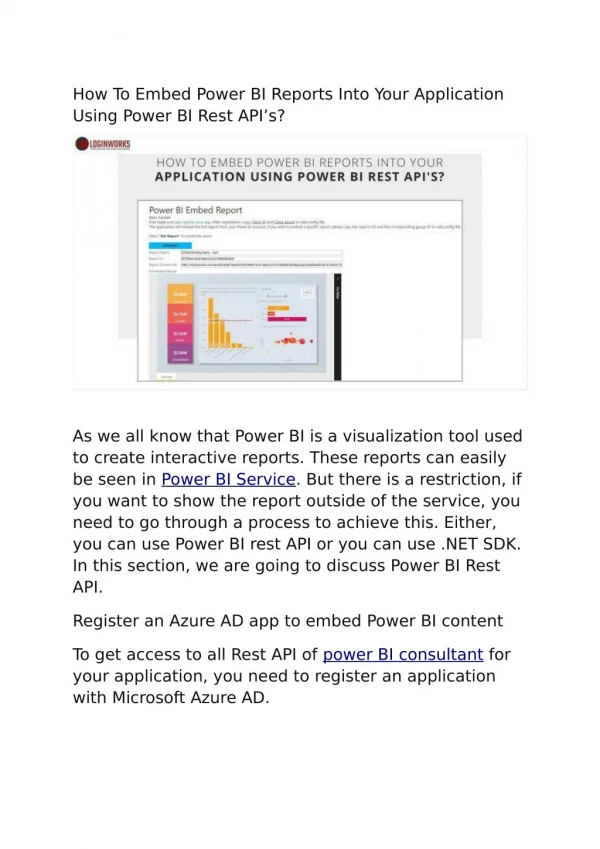
JReport Highlights Advanced, Embedded Data Visualization Platform: High Performance and ScalableIntelligent push-down technology In-memory cubes Server clustering Self-ServiceSo easy anyone can create & useInteractive charts, controls, widgets Flexible Any data source: from RDB to Big Data and Cloud Customizable and embeddable Delivery options 2
Market Positioning Complex Systems Embeddable Power Traditional BI JReport Performance and Features Open Source Legacy Tools Simplistic Solutions Ease of Embedding 3
JReport Solution Areas Visualize. Analyze. Discover. Dashboards& Reports Embedded BI Analytics Mobile BI 4
Embedded Solution ACME Financials Company Sales 5 BI Platform • Security, administrative features • Customizable look and feel Metadata Management • Organize/publish/search of: dimensions, hierarchies, measures, formula, components, reports into catalogs Development Tools • JReport Designer: build components, reports, dashboards • API for application embedding
Ways to Embed BI JReport works with all deployment types. Any applicationEmbedded into customers’ applications or productsTypically hosted “on-premise” Customizable, manageable, secure, scalable Software as a Service (SaaS)Web based for internal users or external subscribers Typically hosted in the cloudVariety of licensing models for subscribers 6
Integration Options Depth of Integration Application Weblayer Business layer Application Embedded Deployment Integration Server Integrated Standalone JReport JReport Server JReport Server URL API Java APIs Functional Integration 7
UI Integration • URL Integration • Example to call a report by URL: • http://localhost:8888/jinfonet/tryView.jsp? • jrs.cmd=jrs.try_vw&jrs.catalog=SampleReports/SampleReports.cat • &jrs.report=SampleReports/MultimediaObjects.cls&jrs.result_type=8 8
Flexible data sources Sort, filter, link to reports,drill into details, expand/collapse groups Themes, profiles, print layouts Security and Governance 1-click data interaction Ad Hoc Reporting 9
Ad Hoc Analytics Visual Analysis Interactive UI with drag-and-drop functionality Quickly change data views Powered by in-memory cubes 10
Easily drag/drop from library Reuse reports, components, analytics 3rd party widgets e.g. Google Maps Sort, filter, drill, pivot, slice-n-dice, parameters, export Synchronized refresh HTML5 JDashboard: Interactive Visualization 11
Interactive Data Exploration Link Reports Drilling on Charts Customize Parameters On-Screen Filters Conditional Formatting Component Synching 12
Live Charts Motion Charts Real-time Charts Scrollable Charts 13
Big Data and Visualization 14 • Big Data – large, complex set of data • Genomics data, traffic data, social media data • NoSQL databases – non-relational, distributed, open-source and horizontally scalable • MapReduce – parallel processing using Master-Worker nodes • MongoDB – aggregations and detailed data • Apache Hadoop – MapR, Hortonworks, Cloudera • Visualization of Big Data
Information Delivery Web Mobile 15
JReport 13.1 Highlights • Visual Analysis • VA as dashboard components • Rich data discovery • Product unity • Enhanced SaaS enablement • Full multi-tenancy • Tools for developers • Flexibility, usability, security • Multiple data sources (distributed joins) • Richer customization 16
Demo: What You’ll See 1. Embedded Reports & Dashboards 2. Geo Analysis and Heatmaps 3. Visual Analysis + JDashboard 17
Global Customer Base Financial Services Consumer / Manufacturing Telecom Healthcare / Healthcare Insurance ISV/OEM Government 18
Next Steps • Look for our follow-up email • Exclusive JReport 13.1 Trial • Free Proof of Concept • Whitepaper: Embedded Reporting, Dashboards and Analytics in OEM/SaaS Applications • On-Demand Product Demo – Watch it anytime • For more info, visit: www.jinfonet.com E-mail: dyao@jinfonet.com Phone: (240) 477-1000 Follow us @Jinfonet 19