Download
1 / 4
40 likes | 203 Views
I don't think the problem of measuring above-the-fold visual QoE (quality of experience) is fully solved by either Speed Index (SI) or Perceptual Speed Index (PSI) – but they are good starting points on that path.

E N D
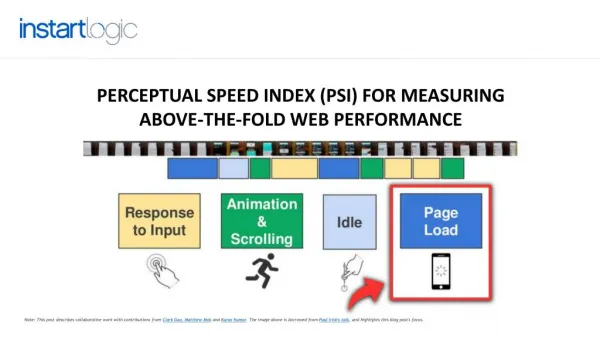
PERCEPTUAL SPEED INDEX (PSI) FOR MEASURING ABOVE-THE-FOLD WEB PERFORMANCE Note: This post describes collaborative work with contributions from Clark Gao, Matthew Mok and Karan Kumar. The image above is borrowed from Paul Irish's talk, and highlights this blog post's focus.
Sometime last year when I started to dig deeper into web performance and how human end users perceive the process of webpage loading, it quickly became clear that typical W3C standard metrics weren't sufficient. I also learned (painfully) that popular page-level metrics like onLoad could be easily gamed via scripting tricks. I became particularly fascinated with the problem of measuring the above-the-fold web page loading process – one that's almost a computer vision type of a problem (though my computer vision friends don't know about it yet). A couple of early discoveries kept me going: • Pat Meenan had proposed a metric called Speed Index that was attempting to address this above-the-fold loading measurement issue. He open sourced his VisualMetrics GitHub repository, which allowed me to compare the Speed Index equation to the implementation code to see what's happening inside. • Paul Irish had given a talk at the Fluent Conference on perceived webpage performance. His talk had a RAIL model that was trying to formalize various phases of human-webpage interaction. My initial instinct was to focus on the "loading" part of the RAIL model he described. • I suspected that the histogram-based comparisons used in Speed Index's visual progress calculations could lead to some issues (see the examples in the slide deck below for a gory exploration of this aspect). I was annoyed by the fact that visual jitter (caused by layout instability, weird ad behavior or carousel elements, etc.) wasn't being captured by histogram-based calculations. I spent some time working out the math, and finding a way to address this issue in the computation of visual progress. By March/April 2015, I had arrived at a different formulation that relied on Structural Similarity (SSIM). Fortunately, I found colleagues (Karan at first, Clark and Matthew later on) who were also interested in this topic, so we kept taking stabs at it whenever we found time. I reached out to Pat and it started a collaboration that ended up leading to some cool insights. What we have developed is Perceptual Speed Index (PSI), a novel metric that measures the above-the-fold visual performance of a webpage, while accounting for the layout stability. The code is open source, so you can go play with it if you like.
Some key take-aways: • While SI focuses on addressing the question "did most of the webpage above-fold content load quickly?", PSI focuses on addressing the question "did most of the webpage above-fold content load quickly without visually noticeable jitter?" • Both SI and PSI will be small when the webpage offers high-quality above-the-fold visual performance. • If the webpage shows layout stability problems (like when an ad pops up and pushes the entire content down), PSI will be large. SI typically ignores the fact that layout was thrashing. Both are valid but different philosophical views of the same problem. • SI and PSI are complementary measures of above-the-fold visual quality of experience of a webpage. • In large-scale empirical studies that we conducted (using 500+ Alexa top mobile webpage videos collected via WebPagetest), we find that SI and PSI are linearly correlated ( at 0.91, to be precise). This means most of these webpages aren't visually jittery. In the cases where visual jitter or layout stability problems exist, SI and PSI differ quite a bit. • Both SI and PSI are computed on an input video of webpage loading. You can easily grab such a video by running the URL through WebPagetest. It's free! • Treating the visual QoE (quality of experience) measurement as a video- (or multiple image frame-) based problem allows multiple web delivery modes (desktop web, mobile web, native app) to be handled in a coherent, unified manner. I particularly like this aspect. • Parting thoughts: Between SI and PSI, we have two complementary metrics that do a good job of informing whether above-the-fold loading process is fast and visually stable. Normalized differences between these two metrics will be interesting to play with. All the code is in the public domain. • Looking ahead: I don't think the problem of measuring above-the-fold visual QoE (quality of experience) is fully solved by either Speed Index (SI) or Perceptual Speed Index (PSI) – but they are good starting points on that path. I feel that we are just scratching the surface of a very interesting visual perception problem. We will continue to explore this. Stay tuned on that front. • Pointers: • Speed Index • VisualMetrics GitHub repository (hosts code for Speed Index, Perceptual Speed Index etc.) • Slide deck on PSI and experimental results.
Instart Logic is the world’s first endpoint-aware application delivery solution that makes websites and applications fast, secure, and easy to operate. Interested in learning more? Preview our image optimization capabilities in the Playground Contact Sales