Fishbone diagrams
60 likes | 95 Views
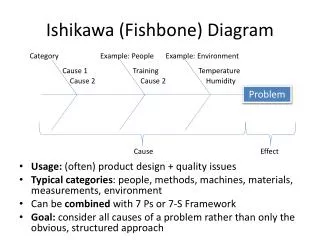
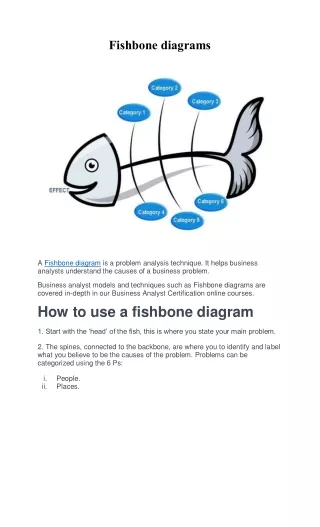
A Fishbone diagram is a problem analysis technique. It helps business analysts understand the causes of a business problem.

Fishbone diagrams
E N D
Presentation Transcript
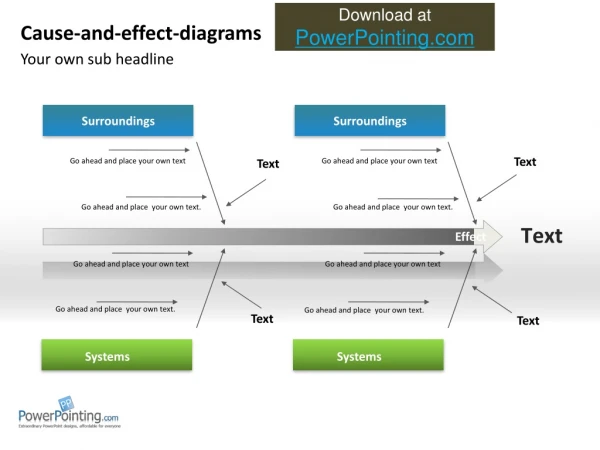
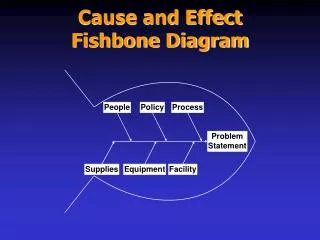
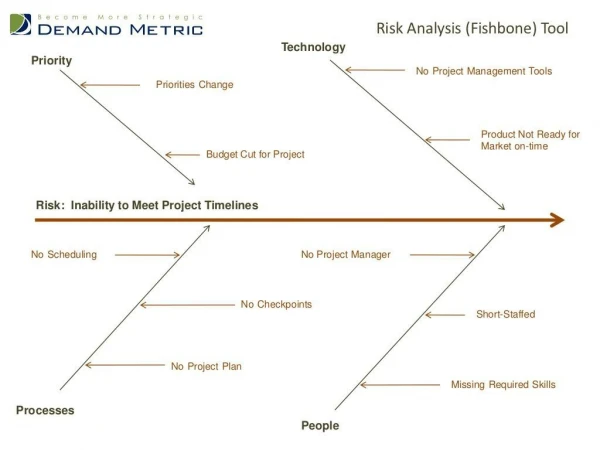
Fishbone diagrams A Fishbone diagram is a problem analysis technique. It helps business analysts understand the causes of a business problem. Business analyst models and techniques such as Fishbone diagrams are covered in-depth in our Business Analyst Certification online courses. How to use a fishbone diagram 1. Start with the ‘head’ of the fish, this is where you state your main problem. 2. The spines, connected to the backbone, are where you to identify and label what you believe to be the causes of the problem. Problems can be categorized using the 6 Ps: i. ii. People. Places.
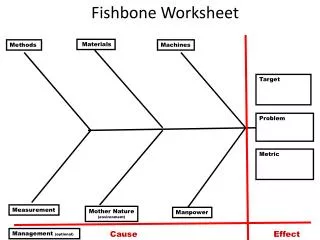
iii. iv. v. vi. Processes. Physical evidence. Products/services. Performance measure. 3. Elaborate on each main cause. Example ‘Head’ (i.e. main problem) Unable to meet project deadlines Lack of teamwork. Poor communication. People Communication is difficult. People are split between different floors. Places Roles are unclear. No defined methodology. Processes Intranet information is out-of-date. Faulty deliverables. Physical evidence Weak quality strategy. No business case. Product/services No clear benefit measurement. Lack of reporting. Performance measure In this example, we can see how a Fishbone diagram can help visually display some of the issues faced by a business. This makes it easier for business analysts to determine root causes and for decision-makers to identify areas for improvement.
Fishbone diagram infographic The following infographic explains how to use fishbone diagrams in greater detail.