Download
1 / 63
660 likes | 890 Views
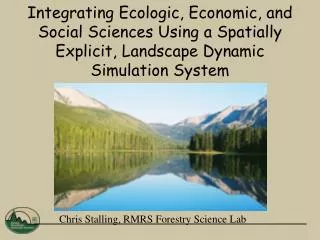
The Science of Forestry. Boris Zeide zeide@uamont.edu Professor of Forestry School of Forestry University of Arkansas at Monticello. 30 Years Ago …. Two Is Between the Extremes. Of many (all) points on a curve and One. What Has Been Done Since Then?. In 1978: Two-point method

E N D
The Science of Forestry Boris Zeide zeide@uamont.edu Professor of Forestry School of Forestry University of Arkansas at Monticello
Two Is Between the Extremes • Of many (all) points on a curve and • One
What Has Been Done Since Then? • In 1978: • Two-point method • Purely an empirical finding • No theoretical rationale. • In 2008: • I now understand why this method works. • As a result, it has become possible to describe many other things, including the entire forestry.
A Fundamental Equivalence • # of points = # of local parameters = # of growth factors • Equations may contain global parameters or constants.
Reinforce Oppose OR Reinforcement or Opposition? Do the equation terms each other?
EmpiricalSupport • Current annual increment first increases, then decreases. • This fact indicates that factors of growth are opposites. Increment Age
Two Sides • Every complex problem has two opposing sides. • The key is to recognize both.
… and vice versa • Many of our errors can be traced to taking one side for the whole. • The rest of my talk is an illustration of these simple points.
A Description of Growth • A complete, if coarse, description of growth: • where the increase of organism size, dy, during an instant of time,dt, is presented as the product of influences that facilitate the growth and those that check it.
Growth Expansion Basic growth process is Unrestricted cell division The growth rate is proportional to either • the number of cells or • the size of an organism
Complications • The proportion of living cells decreases • where k is the coefficient of proportionality • andp< 1 is the allometric coefficient specifying the diminishing portion of living tissue.
Growth Decline • Unlimited expansion is checked by aging and finite area. • The simplest assumption is that growth declines linearly with age: • where q is the constant rate of decline. This module predicts the complete termination of growth at age t = 1/q. Afterwards, the growth would be negative, which is not realistic.
Adaptation • The linear growth decline is counterbalanced by phenotypic (built-in) adaptation. • Deceleration of growth decline is proportional to the current rate of decline:
Adaptation – Growth • Integration results in a non-linear growth decline: • The requirement that . This module can be viewed as the sum of the infinite number of terms of a Taylor series.
Combined Model of TreeGrowth • The product of the growth expansion and decline modules unites two opposite trends in a model of tree growth:
Tree Growth Positive Factors Negative Factors Unlimited cell division Limited volume of live tissue Growth restraints Adaptive alleviation Structure of the Growth Model
Empirical Verification • The equation favored by foresters for growth modeling: • It does not look like the derived model.
Empirical Verification • Actually, the Richards equation is identical to the derived model: • Integration with specific values of the parameter p produces the Gompertz (p = 1), logistic (p = 2), and Bertalanffy (p = 2/3) equations.
Empirical Verification • In the Richards equation a, b, and c are
What Does the Identity Tell Us? • The biological processes and their analytical forms have substance. • The success of the empirical equations, reflects the fact that they unwittingly express the basic processes of growth. • While the processes infuse meaning into the empirical equations, the equations give shape to the processes, making them tangible and operational.
Why Are Two Points Sufficient? • Because those opposites are related. • Out of three parameters of the Richards equation, only two are independent. • Parameter c is global. It is determined by tree structure rather than site quality, growth rates, or tolerance.
Growth curves combined at 50 years • Heights of 36 spruce trees of site class 16.4 combined at 50 years Guttenberg, A.R., von. 1915. [Growth and yield of spruce in Hochgebirge.] Franz Deuticke, Wien. 153 p.
Growth curves combined at inflection • Rescaled heights and ages of 104 spruce trees combined at the inflection point
Shortcoming of Growth Equations • Growth equations cannot reflect variations in stand density.
Density Module: Opposites • A total lack of competition among trees and full availability of resources. • The extreme competition and density that preclude any growth. The growth model describes the first opposite.
Density Module: Solution Given adaptation, the decrease in volume growth, -dy', is proportional to the product of volume growth and density increase, y'dS, rather than to the density increase dS alone: where S is stand density and m is a parameter.
Tree Growth-Density Model Incorporating the density module into the growth model produces a growth-density model describing tree growth in stands of any age, size, and density:
Stand Growth-Density Model Multiplying the volume growth of average tree, v’, by number of trees produces stand growth: Stand growth in terms of average diameter, age and density:
Forest Management • The theory outlined above exposes the inner mechanisms of forest stand dynamics. It is about regularities inferred from past observations. • In contrast, forest management is active and forward-oriented; it is prescriptive rather than descriptive.
Two Goals Of Management • Preserving the environment, and • Meeting the current and future wood products needs of an increasing human population. All the diversity of forest management is made of various combinations of these two opposite goals.
Solution: Spatial Separation • Conflicting goals cannot be satisfied at the same time and at the same place • But they can be satisfied in different places.
Solution: Spatial Separation Spatial separation reverses the conflict between the goals and makes sustainable intensive management for wood products a prerequisite for the existence of undisturbed forests.
Maximizing Combined Utility • Why not combine some use with some conservation on the same land? • Why not thin stands before trees rot? • Or leave some patches of native vegetation in the middle of forest plantations and agricultural fields?
Maximizing Combined Utility • Because curtailed preservation on the same land would detract from both environmental quality and production. • Spatial separation maximizes the combined utility.
How To Manage For Preservation Opposites: Restoration ecology versus the "hands-off" approach. Solution: Leave nature alone.
How To Manage For Preservation • Nature is the generator and best manager of biodiversity. It is counterproductive and supercilious to interfere with its eternal work of creation and destruction.
How To Manage Wood Production • A promising way to preserve nature is to increase productivity on the portion of land devoted to the second goal of forest management – wood production.
How to Manage Wood Production • Aside from expensive and not-always-rewarding site alteration, this can be done by • minimizing interspecific competition and • optimizing intraspecific competition.
Interspecific Competition • Among the various benefits ascribed to biodiverse forests are: • higher productivity, • beauty, and • stable dynamics. • None of these claims is not supported by evidence.
Interspecific Competition • In fact, interspecific competition is one of the most harmful factors of tree life. • kills many trees • prevents others from reaching their growth potential. • Interspecific competition should be minimized.
Intraspecific Competition Current consensus: • thinning can redistribute growth from smaller to larger stems but not increase its amount “As long as the site is fully occupied (trees making their full use of available resources), the species will produce the same amount of wood per year at various densities. Whether there are many small trees or fewer large trees, a similar wood volume is produced” (Spurr and Barnes 1980: p.376).
Empirical Basis of Consensus Langsaeter's curve Relationship between standing volume and volume increment by Langsaeter (1941)
A Problem with the Consensus • Stand growth is a function of average diameter, age and density:
Optimal Density = m • Differentiating this equation with respect to density and setting the derivative equal to zero allows us to determine the density at which the current stand volume growth reaches maximum.
Optimal And Normal Densities • m = 678±39 • For undisturbed permanent plots (control and initial measurements) of the Monticello study, normal density is 638±16 • When the difference in diameter is taken into account, the highest growth is observed in stands of high, and not medium, density
Volume Growth and Density • Relationship between volume growth (m3/ha) and current density for loblolly pine stands • equal age (20 years), • diameter (25 cm), and • site index (20 m) (base=25 years).
Sum of Growth Maxima Is Not Maximum • If volume growth is maximum at the highest current density, then this density should maximize the total yield over rotation. • But this inference contradicts forestry experience, which tells us that moderately dense stands are more productive.
Inverse Relationship • An inverse relationship exists between tree size and average density. • Although, at a given moment, normal density does produce maximum growth, when it is maintained over an extended period, the same density suppresses diameter and, as a result, reduces volume growth and volume, itself.