Download
1 / 31
350 likes | 1.12k Views
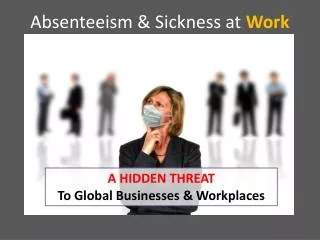
Absenteeism “Facts”. Paid absences are not universal ● 39% of U.S. employees do not receive paid sick leave (2009); few small businesses offer ● 1/3 of FT Iowa employees have no paid sick leave (81% of part-timers). Financial cost estimates are highly variable

E N D
Absenteeism “Facts” Paid absences are not universal ● 39% of U.S. employees do not receive paid sick leave (2009); few small businesses offer ● 1/3 of FT Iowa employees have no paid sick leave (81% of part-timers). Financial cost estimates are highly variable ● Absenteeism costs are about 9% of payroll (Kuzmits & Adams 2009 article give you more statistics) Can necessitate temporary or surplus employees, can affect customer service Shareholders/Boards of Directors expect control
Absenteeism Issues • What is excessive? Multiple metrics: • Number of sick days used • - Dept of Labor: Mean is 8 days • - Iowa data • Changes in absence rates (paid unscheduled • absence hours/paid productive hours) • Range: 1.9% in 2003 to 3.1% in 2008 • Lower in bad economic times, higher in good times • Other data: 2.5% (2006), 2.3% (2007), 3.1% (2008), • 3.0% private sector (2009, 2012) • 4.0% public sector (2009)
Absenteeism Issues • What is excessive? Multiple metrics: • Number of sick days used • - Dept of Labor: Mean is 8 days • - Iowa data suggests people use half • Changes in absence rates (paid unscheduled • absence hours/paid productive hours) • Range: 1.9% in 2003 to 3.1% in 2008 • Tends to be lower in bad economic times, higher in good • times; higher in public sector (4%) than in private • sector (3%). > 3% usually viewed as excessive
Focus: Managing Voluntary Absenteeism • Determining what % of absence is voluntary (avoidable/motivational) and what is non-voluntary (due to inability) is tricky • Experts believe ~40% is voluntary and ~ 60% is non-voluntary* • 40% may be the “max” managers can affect (a restriction in range) • Managers disagree as to what is a valid excuse *Navarro & Bass (2006) report 35% of absence due to personal illness, 21% family issues
Summarizing: What is an Excused Absence? • May be contingent on empowerment (discretion) of supervisors • Absence policies remain ambiguous • a. Personal/dependent illness • b. Gray areas: relative illness, business affairs, • lack of transportation, “domestic maintenance” • c. Truly discretionary: take a day off, wedding, • special event
Summarizing: What is an Excused Absence? • Explains popularity of PTO (Paid Time Off) and “no fault” absence policies. SHRM: 33% of firms in 1997, 51% of firms in 2012 • Generous plan: 10 sick days, 3 personal days, 5 holidays, 10 vacation days for a total of 28 days. • Recordkeeping time frames dependent on magnitude of the problem (from no tracking to yearly, to quarterly, to monthly)
Absenteeism Measures 1. FrequencyMeasure: total # of times/period absent ( 4) 2. Severity Measure: total # of days/period ( 7) (most common) 3. Attitudinal Measure: Frequency of 1 day absences (2) 4. Medical Measure: Frequency of > 3 day absences (1) 5. Worst Day: # people absent on any given day (e.g., Monday) February S M T W TH F S 1 2 3 4 5 6 7 8 9 10 11 12 13 14 15 16 17 18 19 20 21 22 23 24 25 26 27 28 March 1 2 3 4 5 6 7 8 9 10 11 12 13 14 15 16 17 18 19 20 21 22 23 24 25 26 27 28 29 30 31 April 1 2 3 4 5 6 7 8 9 10 11 12 13 14 15 16 17 18 19 20 21 22 23 24 25 26 27 28 29 30
Model of Employee Absenteeism 3. Personal Characteristics -Education -Sex/Family -Org. tenure responsibility -Age (also depends -Family size on sex) -Personality 7. Ability to Attend -Health (Depression, pain cardio fitness, smoking, drug use) -Illness & accidents -Family responsibilities -Transportation problems -Travel distance 2. Recruitment + Selection Job expectations about Attendance 1. Job Situation -Job autonomy -Job level -Work group size -Role Stress -Considerate leadership style -Coworker relationships -Scheduling (flexible, rotating) 4. Job Attitudes -Job satisfaction -Organ.commitment -Job involvement 8.Employee Absenteeism (Attendance) 6. Attendance Motivation 5. Pressures to Attend -Economic/market conditions -Human Resource Practices (incentives, control policies) -Work group norms/culture -Profit sharing/employee share ownership
Review of Absenteeism Model • Box 8: Employee Absenteeism or Attendance • Box 1: Job Situation ↑ Job autonomy → ↓ Absenteeism • Box 2: Recruitment and Selection • Box 3: Personal Characteristics • Box 4: Job Attitudes • Box 5: Pressures to Attend (next slide)
Personal Characteristics (Box 3) • Education: No consistent pattern. • Org tenure: ↑ Tenure → ↓ Absenteeism • Age: Younger more short term; older more long term. Age/sex: Men: ↑ Age → ↓ Absenteeism Women: No relationship • Family responsibility: Parental status and elder care issues (by 2020 1 in 3 will have the latter; boxes 3 & 7) • Family Size: ↑ Size → ↑ Absenteeism
Personality(Box 3) • ↑ Conscientiousness → ↓ Absenteeism • ↑ Extroversion → ↑ Absenteeism • ↑ Anxiety/depression → ↑ Absenteeism
Human Resource Practices for Managing Absenteeism (Box 5) • Review incentive systems like lotteries (nurse example) • Be willing to modify practices over time • Determine whether cost/benefit of incentives are consistent with organizational culture
Human Resource Practices for Managing Absenteeism (Box 5 continued) • Work group norms and culture • Profit sharing; employee ownership
Family Responsibilities: Examples of Costs Associated with Eldercare ● Absenteeism ● Workday interruptions ● Going part-time ● Eldercare crisis ● Supervisor time ● Taking unpaid leave ● Replacing the 9% of workers who quit Solutions: subsidizing in-home care for employee’s dependent, referral services to caregivers and nursing homes, providing extended leaves of absence. Be “employee need specific”: Japanese heartache leave
RECOMMENDATIONS FOR INCREASEDUNDERSTANDING OF ABSENTEEISM 1. Use standardized measures and time frames 2. Study attendance 3. Study white collar absenteeism 4. Examine how other HR practices affect absenteeism (next 2 slides) 5. Encourage health 6. Engage in more creative thought
Effects of Various Human Resource Practices on Reducing Absenteeism Method# of StudiesEffect Well Pay (unused sick leave) 4 High Flextime 10 High Compressed work schedules 5 Medium Discipline 12 Medium Recognition 6 Medium Wellness programs 6 Low Other financial incentives (bonus) 7 Low Games 6 Low Profit sharing/employee ownership 3 Medium Team/group reward systems ?? ??? PTOs, time-off banks ?? ???
Effects of Various Human Resource Practices on Reducing Absenteeism: HR Professionals Method % of Companies Effectiveness using in 2007 (1-5 very effective) Well Pay (Buy back unused sick leave) 53 3.4 Verification of illness 74 3.2 No-fault 59 2.9 Disciplinary action 89 3.4 Personal recognition 57 2.6 Part of yearly performance review 82 2.9 Bonus 51 3.3 Paid-leave banks (PTO) * 60 3.6 Adapted from CCH, www,cch.coom/preess/news/2007 *PTO may not decrease absenteeism, just make it more planned.
PRACTICAL STRATEGIES FORREDUCING ABSENTEEISM 1. Increase job satisfaction/autonomy via a. Job redesign c. Decreased stress b. Supervision d. Flexible schedules 2. Use motivation strategies more frequently and creatively a. Operant conditioning b. Goal setting 3. Use work group dynamics a. Small groups b. Promote attendance norm; tie to rewards?
Readings • Navarro & Bass • Kuzmits & Adams • Johns • Judge et al.
Readings • What were your “take-aways” from Navarro & Bass?
Kuzmits & Adams (2009) • What were the key parts of a no-fault absence system? • Summarize the study setting and research design • What were the major findings? • How generalizable are these results?
Johns Article • Employees & managers estimate absenteeism inaccurately. Why? • Under-reporting tendency noted in 9 hypotheses, suggesting bias extends to group level • What was the sample and attendance policy? • Review Table 1 to understand why there are two sets of data and Hyp. 4
Johns Article • What did the partial replication show? • Implications: People under-report absenteeism extensively. Are they deliberately lying? How can the under-reporting tendency be addressed? • Is self-serving bias evident in non-western societies? • Though no actual absence data, yes. Stronger at group level among Chinese managers
Results: Hyp. 1, 2, 3, 6, 7 & 8 and Partial Replication Mean 9 Days 8.83 School Teachers Absent 8 8.36 7 7.47 7.31 6.21 6 H1Utility Employees 5 H6{ 5.91 H3 H7{ H2 4 3.65 3.22 3 H8 (ns)3.31 Utility Managers 2 1 Occupa- Group Self Actual tional Norm Estimates Report Absence Absence Measure Figure 1. Mean days absent (estimated or actual) for three samples.
Judge et al. (1997) • Relates “”Big Five” to absenteeism. Move beyond situational causes of absenteeism to dispositional one which might be usable at the time of selection • How is each trait hypothesized to be related to absence behavior? • What does Hyp. #4, stating that absence history will mediate the relationship between personality and absence mean?
Personality Traits Absence Proneness Absenteeism T1 “Mediator” T2 T3 Research Model: Judge et al. 1997
Judge et al. (1997) • What was the sample and response rate? • How were personality, absence proneness, and absence behavior measured? • Were Hypotheses 1-3 supported? Table 2 • Was Hypothesis #4 supported? Table 3 • In what ways, if any, could you use this information in the selection process?
Absenteeism Issues • What is excessive? Multiple metrics: • Percent of working hours lost to • absenteeism (> 3% excessive) • # worker days lost per month • (Avg # employees) X (# work days) • ●Need industry/ region comparatives
Absenteeism Costs: Firm Level Estimates Large Firm 3% absence rate translates to 8 days/year per employee 25,000 employees = 200,000 lost work days Average daily pay is $159.36 200,000 lost work days X $159.36 means the estimated direct costs to the firm would be $31,872,000 Small Firm 7 days/year per employee 30 employees Average pay is $10/hour $18,700/year including payroll taxes (WSJ 3-1-12)
*Based on Harrison & Martocchio, 1998, Journal of Management 24 (3): 305-350.