Download
1 / 30
300 likes | 444 Views
The Determinants of Operational Risk in Financial Institutions. P HILIPPE J ORION University of California, Irvine. A NNA C HERNOBAI Syracuse University. F AN Y U Claremont McKenna College. April 24, 2009 Risk Management in Financial Institutions, Audencia Nantes School of Management.

E N D
The Determinants of Operational Risk in Financial Institutions PHILIPPE JORION University of California, Irvine ANNA CHERNOBAI Syracuse University FAN YU Claremont McKenna College April 24, 2009 Risk Management in Financial Institutions, Audencia Nantes School of Management 1/29 P. Jorion Chernobai, Jorion, Yu - 2009
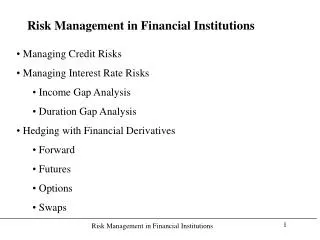
Background: Definition • Definition: Operational riskis the risk of loss resulting from inadequate or failed internal processes, people and systems, or from external events. • Categories include: • Internal fraud • External fraud • Employment practices and workplace safety • Clients, products, and business practices • Damages to physical assets • Business disruption and system failures • Execution, delivery, and process management 2/29 P. Jorion Chernobai, Jorion, Yu - 2009
Background: Drivers • The distribution of operational losses over the next year is usually constructed from two risk drivers: • Frequency of loss: number of events over period • Severity of loss: size of loss when it occurs Severity Frequency Loss over period 3/29 P. Jorion Chernobai, Jorion, Yu - 2009
Background: Rationale • Focus: Financial industry • New capital adequacy framework (Basel II)includes a new regulatory capital charge for OpRrisk • Allows Advanced Measurement Approach (AMA), based on economic capital at 99.9% over 1 year (e.g., VAR) • Bank also compute their own economic capital • OpRisk accounts for significant fraction of total risk: 4/29 P. Jorion Chernobai, Jorion, Yu - 2009
Background: U.S. Examples • ET1: Internal fraud • $3,120m, Cendant (1985): accounting fraud • ET2: External fraud • $568m, Mutual Omaha (1982): insurance fraud • ET3: Employment practices and workplace safety • $235m, AIG (2000): discrimination • ET4: Clients, products, and business practices • $3,660m, JPM (1997): Enron settlement • ET5: Damages to physical assets • $2,230m, Citigroup (2001): losses due to 9/11 • ET6: Business disruption and system failures • $207m, FHLMC (2001): error in computing interest • ET7: Execution, delivery, and process mgt. • $459m, Cendant (1998): aborted acquisition 5/29 P. Jorion Chernobai, Jorion, Yu - 2009
Motivation • Operational risk is a major stand-alone risk: • - Roger Ferguson, former Fed Vice Chairman (June 18, 2003): Operational risks “have become an even larger share of total risk [and] at some banks they are the dominant risk.” • Operational losses are NOT “one-off” events and • may signal serious internal control flaws: • - GARP (Feb. 2, 2008): “Some of the simple, unspoken rules at SocGen were ``you never get punished for making money regardless of the rules broke’’ or ``make as much money as possible.’’ ” • - Financial Times (July 16, 2008): “Organisations with weak data security are generally also weak in terms of wider risk management and governance. So a failure adequately to manage information security risks is often symptomatic of broader risk issues. […] ” • Macroeconomic environment can play a role: • - BCBS (2006): “Dependence structures [between operational losses] could occur as a result of business cycles (e.g., economic difficulties that cause an increase in rogue trading and fraud)” 6/29 P. Jorion Chernobai, Jorion, Yu - 2009
Motivation • Operational losses vs. financial defaults: Number of operational losses What drives OpRisk? Is there a link? Number of financial defaults 7/29 P. Jorion Chernobai, Jorion, Yu - 2009
Literature • Size of operational losses • de Fontnouvelle, DeJesus, Jordan, and Rosengren (2006 JMCB) - Describe the severity distribution of OpRisk losses - Capital requirements could exceed those for market risk • Stock price impact of operational losses • Cummins, Christopher, and Wei (2006 JBF) - OpRisk events cause market value loss due to reputational loss - Especially banks with higher growth prospects • Perry and de Fontnouvelle (2005) - Market values fall 1-for-1 with losses due to external events - Market values fall by more with losses due to internal fraud - The effect is more significant for banks with strong shareholder rights • Exposure to macroeconomic factors • Allen and Bali (2006 JBF) - Use equity returns, not actual operational loss data - Find cyclical components 8/29 P. Jorion Chernobai, Jorion, Yu - 2009
Literature • Related to recent studies of corporate defaults • Duffie, Saita, & Wang (2007 JFE) - Estimate time-varying intensity of corporate defaults using compound Poisson model - Default intensity is a function of Merton’s distance to default, stock return, S&P 500, interest rates Link: Operational loss events are unevenly spaced in time Poisson framework is relevant • Related to studies on earnings restatements • Burns & Kedia (2006 JFE), Efendi & al. (2007 JFE), etc. • - Sensitivity of CEO options to stock price is positively related to propensity to misreport • - Greater options holdings increase likelihood of misreporting • Link: Operational loss events of various types are directly linked to • internal controls and CEO compensation structure • Executive compensation can help explain probability of OpRisk 9/29 P. Jorion Chernobai, Jorion, Yu - 2009
Data Description • Data source Algorithmics’ Financial Institutions Risk Scenarios Trends (FIRST) database • Data collection process Public sources, mostly 3rd parties: • SEC filings • NYSE • Court orders • Customers, investors • Media • Sample used in our study - U.S. financial industry (SIC 6xxx) - 1980 – 2005 • Issues and limitations: • Larger-scale events (upward bias) • Discovery bias • But no or little self-selection bias Only firms with info in CRSP and Compustat 176 firms; 925 events 10/29 P. Jorion Chernobai, Jorion, Yu - 2009
Data Description • Event types (Basel II definitions) ET1: Internal Fraud – unauthorized activity, theft & fraud involving at least 1 internal party ET2: External Fraud – theft & fraud by a 3rd party, systems security ET3: Employment Practices and Workplace Safety – discrimination, general liability, compensation ET4: Clients, Products, and Business Practices – improper business & market practices, model errors ET5: Damage to Physical Assets – natural and man-made disasters, vandalism ET6: Business Disruption and Systems Failures – hardware & software failures, telecommunications ET7: Execution, Delivery, and Process Management – data entry error, missed deadline, delivery failure Other • Distribution • Majority of operational risk events occur in ET1, ET2, ET4 • Very few (but significant in $) in ET5 11/29 P. Jorion Chernobai, Jorion, Yu - 2009
Data Description • Most frequently citedcontributory factors • Lack of control • Management action/inaction • Employee misdeeds • Organizational structure • Excessive concentration of power • Changes in market conditions • Classify events into 5 categories Internal External Exclude Damage to Physical Assets: too random 12/29 P. Jorion Chernobai, Jorion, Yu - 2009
Frequency Analysis: Basic Framework • Operational loss process (simplistic; used in practice) ● Nt and X are independent ● homogeneous Poisson process ● constant arrival rate ● X i.i.d., continuous distribution RELAX KEY ASSUMPTIONS • Operational loss process (our model) ●Nt′ and X are independent ● Cox process(doubly-stochastic) ● ● Y and Z both are firm-specific and macroeconomic variables 13/29 P. Jorion Chernobai, Jorion, Yu - 2009
Frequency Analysis: Methodology • Frequency model Nit= function (firm-specific covariates, macroeconomic factors) • Econometric methodology • MLE estimator (arrival of events is a Poisson process) • Panel data (1 panel = 1 firm) • Firm-month data: 195,888 firm-months • Include all financial firms with and without losses • Dependent variable: monthly aggregated loss count • Independent variables: firm-specific and macro-level 14/29 P. Jorion Chernobai, Jorion, Yu - 2009
Frequency Analysis: Results • Result 1: • Larger firms experience more frequent losses • (MVE ***) • Larger banks have higher number of losses • Why? Larger volume and greater complexity of transactions • Or:Larger banks are more in the public eye ? • Other firm size measures (Total Assets, Net Income, Total Liabilities) 15/29 P. Jorion Chernobai, Jorion, Yu - 2009
Frequency Analysis: Results 16/29 P. Jorion Chernobai, Jorion, Yu - 2009
Frequency Analysis: Results • Result 2: • Operational loss events signal financial distress • (low market-to-book **, high equity volat. ***) • Similar to default risk literature • Financially constrained firms can not devote sufficient • resources to regulatory oversight and internal control • OpRisk and financial distress • Especially true for Internal Fraud and all Business Practices- • related events 17/29 P. Jorion Chernobai, Jorion, Yu - 2009
Frequency Analysis: Results 18/29 P. Jorion Chernobai, Jorion, Yu - 2009
Frequency Analysis: Results • Result 3: • Macroeconomic environment plays a smaller role • Results overall inconclusive: Coefficients often insignificant • GDP growth ( - ) Disposable Income growth ( - ) Overall, OpRisk appears largely idiosyncratic • SEC budget growth (- , mildlysignificant) • but only for Internal Fraud • Basel II dummy (-, significant) for all events Economy slowdown more frequent losses 19/29 P. Jorion Chernobai, Jorion, Yu - 2009
Frequency Analysis: Results 20/29 P. Jorion Chernobai, Jorion, Yu - 2009
Frequency Analysis: Results • Result 4: • More frequent losses with younger firms with more complex operations (number of segments) • (age - ***,number of segments ***) • Less internal controls for young firms • Internal controls less effective for complex firms, with more operating and geographic segments • Even with distance to default variable, which is negative and significant, correlated with default risk 21/29 P. Jorion Chernobai, Jorion, Yu - 2009
Frequency Analysis: Results • All event types: Other specifications 22/29 P. Jorion Chernobai, Jorion, Yu - 2009
Results: An Illustration • Fitted vs. actual frequency All event types ____ Actual ------ Fitted Fraud ____ Actual ------ Fitted 23/29 P. Jorion Chernobai, Jorion, Yu - 2009
Predictability of OpRisk • Our frequency models indicate OpRisk is linked to internal • control environment • Conjecture: • OpRisk could be explained by governance & CEO incentives • Predictions: (a) Governance: Firms with • - Weak shareholder rights have loose internal controls OpRisk • - Auditors on board have strong internal controls prevent losses • - Board independence prevent losses • (b) CEO Compensation • - Higher sensitivity to stock price (“Δ”), bonus/salary, options/salary incentive to loosen controls higher OpRisk • - Higher long-term incentive plan aligned with stockholders prevent losses 24/29 P. Jorion Chernobai, Jorion, Yu - 2009
Predictability of OpRisk: Governance • Logit Model 1: Governance and OpRisk • Prob (oprisk) = function (internal & external governance) • Methodology: • Single cross section • I=0 Control sample: no-loss firms (1998-2005) N=242 • I=1 Treatment sample: loss-firms (1998-2005) N=23 • Key variables: • Gompers, Ishii, & Metrick’s governance index (G-index) • Ratio of auditors on board • Board independence • Results: • - High G-index, weak shareholder rights ( **)for all event types more risk • - High ratio of auditors on board (- **) for fraud only less risk • - Board independence not significant 25/29 P. Jorion Chernobai, Jorion, Yu - 2009
Predictability of OpRisk: Governance 26/29 P. Jorion Chernobai, Jorion, Yu - 2009
Predictability of OpRisk: CEO Compensation • Logit Model 2: CEO compensation incentives and OpRisk • Prob(oprisk) = function(CEO compensation characteristics) • Methodology: • Pooled time-series cross-section • Control sample: no-loss firm-years (1993-2005) N=1527 FY • Treatment sample: loss-firm firm-years (1993-2005) N=533 FY • Key variables: • - CEO option awards’ stock price sensitivity (“Δ”, Core & Guay 2002) • - CEO stock holding ratio • - CEO bonus-to-salary ratio; salary, bonus sensitivity to firm earnings • - CEO LTIP/total compensation ratio • Results: • - In-the-money options / salary (**), bonus / salary (***) more risk • - Long-term incentives not significant 27/29 P. Jorion Chernobai, Jorion, Yu - 2009
Predictability of OpRisk:CEO Compensation 28/29 P. Jorion Chernobai, Jorion, Yu - 2009
Conclusions • Summary of main findings: • Operational risk events are largely idiosyncratic; macroeconomic environment has a limited role • Operational risk events are not one-off events, but are signals of internal control deficiencies • Governance and executive compensation help explain operational risk • Extensions—Current research: • Links between firms’ OpRisk events? Clustering? Preliminary findings: yes! • OpRisk and default prediction(work in progress) Preliminary findings: yes! 29/29 P. Jorion Chernobai, Jorion, Yu - 2009
QUESTIONS? • pjorion@uci.edu • annac@syr.edu • fan.yu@ClaremontMcKenna.edu P. Jorion Chernobai, Jorion, Yu - 2009