1 / 3

Visual Analytics How to Turn Raw Data into Actionable Insights.docx

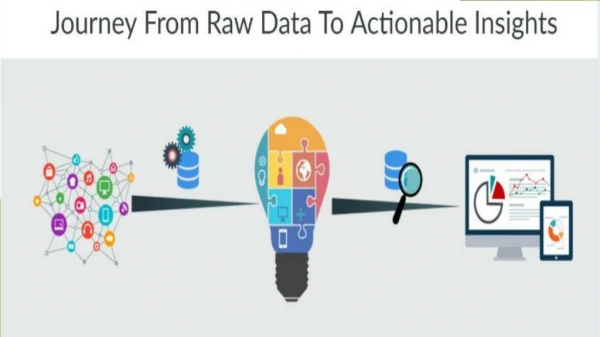
Visual analytics transforms mountains of raw data into clear, meaningful images and reports u2014 like building a masterful LEGO model from scattered bricks. It helps businesses, cities, and organisations spot opportunities, fix problems, and innovate faster.<br>Embracing visual analytics is essential in today's data-driven world. Whether you run an online store, manage urban traffic, or guide public policies, this tool lets you act wisely and with impact.<br>

ExcelR1
Download Presentation

Visual Analytics How to Turn Raw Data into Actionable Insights.docx

An Image/Link below is provided (as is) to download presentation Download Policy: Content on the Website is provided to you AS IS for your information and personal use and may not be sold / licensed / shared on other websites without getting consent from its author. Content is provided to you AS IS for your information and personal use only. Download presentation by click this link. While downloading, if for some reason you are not able to download a presentation, the publisher may have deleted the file from their server. During download, if you can't get a presentation, the file might be deleted by the publisher.

E N D

Presentation Transcript


More Related