Download
1 / 33
340 likes | 532 Views
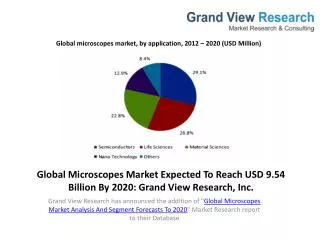
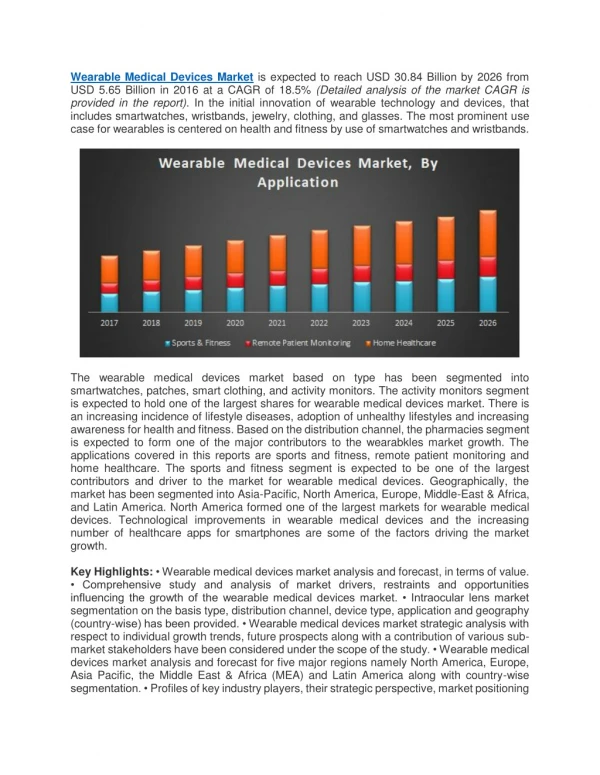
Rising Health Awareness across the Globe to Drive the Wrist Wearable Devices Market to $35 billion by 2020

E N D
IndustryARC Global Wrist Wearable Devices Market Analysis (2015 – 2020) By Components (Power Supply, Sensing, Memory, Display); Products (Smart watches, Smart bands, Monitoring Devices, Fitness); Applications (Lifestyle, Medical, Sports, Infotainment)
TABLE OF CONTENTS 1LIST OF FIGURES .................................................................................................. 12 2MARKET OVERVIEW ........................................................................................... 15 2.1 2.2 2.3 GLOBAL WRIST WEARABLE DEVICES MARKET OVERVIEW ........ 15 GLOBAL WRIST WEARABLE DEVICES TIMELINE ....................... 15 CLASSIFICATION ...................................................................... 16 2.3.1 WRIST WEARABLE DEVICES - BY PRODUCTS .................. 16 2.3.2 WRIST WEARABLE DEVICES-BY APPLICATIONS ............. 17 2.3.3 WRIST WEARABLE DEVICES-BY GEOGRAPHY ................. 17 3EXECUTIVE SUMMARY ....................................................................................... 19 4GLOBAL WRIST WEARABLE DEVICES – MARKET LANDSCAPE ............. 22 4.1 4.2 MARKET SHARE ANALYSIS ........................................................ 22 COMPARATIVE ANALYSIS ......................................................... 23 4.2.1 PRODUCT BENCHMARKING ............................................. 23 4.2.2 END USER PROFILING .................................................... 24 4.2.3 TOP 5 PRODUCT ANALYSIS ............................................ 25 5GLOBAL WRIST WEARABLE DEVICES –MARKET FORCES ...................... 29 5.1 MARKET DRIVERS ..................................................................... 29 5.1.1 QUANTIFIABLE MULTIPLE FITNESS TRACKING PARAMETERS ENTICE NEW CUSTOMERS DRIVING ADOPTION ..................................................................... 29 5.1.2 PERSONAL HEALTHCARE MONITORING TO PROVIDE IMPETUS TO MARKET GROWTH ...................................... 29 5.1.3 MILLENNIAL CRAZE FOR WEARABLE TECHNOLOGY SET TO DRIVE GROWTH ........................................................ 30 5.1.4 INFLUX OF ORIGINAL DEVICE MANUFACTURERS (ODMS) ADDRESSING THE PENT UP DEMAND BY INCREASING AFFORDABILITY ........................................ 30 MARKET CONSTRAINTS ............................................................ 31 5.2.1 EXORBITANT PRICES OF DEVICES RESTRAIN FULL- FLEDGED MARKET GROWTH ........................................... 31 5.2.2 DESIGN COMPLEXITIES AFFECTING USER’S PREFERENCE .................................................................. 31 5.2.3 LOW SUSTAINABILITY IMPACTING GROWTH POTENTIAL .................................................................... 31 MARKET CHALLENGES ............................................................... 32 5.2 5.3
5.3.1 DATA PRIVACY & SECURITY ISSUES TO DAMPEN MARKET GROWTH .......................................................... 32 RELIABILITY & ACCURACY OF A DEVICE POSES CONCERN ....................................................................... 32 HIGH POWER CONSUMPTION BY VARIOUS COMPONENTS CHALLENGING PRODUCT BATTERY LIFE ... 33 ATTRACTIVENESS OF THE WRIST WEARABLE INDUSTRY ......... 33 5.4.1 POWER OF SUPPLIERS ................................................... 33 5.4.2 POWER OF CUSTOMERS .................................................. 34 5.4.3 THREAT OF NEW ENTRANTS ........................................... 34 5.4.4 THREAT OF SUBSTITUTION ............................................ 35 5.4.5 DEGREE OF COMPETITION ............................................. 35 5.3.2 5.3.3 5.4 6GLOBAL WRIST WEARABLE DEVICES-STRATEGIC ANALYSIS .............. 37 6.1 6.2 VALUE CHAIN ANALYSIS .......................................................... 37 PRODUCT/MARKET LIFE CYCLE ANALYSIS ............................... 38 6.2.1 PRODUCT LIFE CYCLE ANALYSIS .................................... 38 6.2.2 MARKET LIFE CYCLE ANALYSIS ...................................... 39 7GLOBAL WRIST WEARABLE DEVICES-STAKEHOLDER ANALYSIS ....... 41 7.1 ELECTRONIC COMPONENT SUPPLIERS ...................................... 41 7.1.1 INTRODUCTION ............................................................. 41 7.1.2 OPPORTUNITIES FOR ELECTRONIC COMPONENT SUPPLIERS .................................................................... 41 7.1.2.1 Development of exclusive technologies & components for better functionality a major area to explore ....................................................... 41 TESTING, INSPECTION & CERTIFICATION BODIES ................... 42 7.2.1 INTRODUCTION ............................................................. 42 7.2.2 TYPES ............................................................................ 42 7.2.3 TESTING ........................................................................ 42 7.2.3.1 Inspection ....................................................... 43 7.2.3.2 Certification .................................................... 43 7.2.4 OPPORTUNITIES FOR TESTING SERVICES PROVIDERS ... 43 APPLICATION DEVELOPERS ...................................................... 44 7.3.1 INTRODUCTION ............................................................. 44 7.3.2 OPPORTUNITIES FOR APPLICATION DEVELOPERS ......... 45 7.2 7.3 8SEGMENTATION – BY ELECTRONIC COMPONENTS .................................. 46 8.1 8.2 INTRODUCTION ........................................................................ 46 DISPLAY ................................................................................... 48 8.2.1 OLED DISPLAY ............................................................... 49 8.2.2 LCD DISPLAY ................................................................. 49
8.2.3 MEMORY ................................................................................... 50 OPTOELECTRONIC COMPONENTS ............................................. 50 PROCESSORS ............................................................................ 50 SENSORS .................................................................................. 51 8.6.1 ACCELEROMETERS .......................................................... 51 8.6.2 GYROSCOPE SENSORS .................................................... 51 8.6.3 OPTICAL HEART RATE SENSOR ....................................... 52 8.6.4 GPS SENSORS ................................................................ 52 8.6.5 ALTIMETER SENSORS ..................................................... 52 8.6.6 PRESSURE TRANSDUCER ................................................ 52 8.6.7 PULSE OXIMETER SENSOR ............................................. 52 8.6.8 UV SENSOR .................................................................... 53 8.6.9 IMPEDANCE SENSOR ...................................................... 53 WIRELESS COMMUNICATION MODULES ................................... 53 8.7.1 BLUETOOTH/ BLUETOOTH LOW ENERGY ........................ 53 8.7.2 NFC ................................................................................ 53 8.7.3 ANT/ANT+ ..................................................................... 54 8.7.4 WIFI .............................................................................. 54 E-PAPER DISPLAY .......................................................... 49 8.3 8.4 8.5 8.6 8.7 9GLOBAL WRIST WEARABLE DEVICES MARKET-BY PRODUCTS ........... 55 9.1 9.2 INTRODUCTION ........................................................................ 55 ACTIVITY TRACKERS ................................................................ 58 9.2.1 FITNESS TRACKERS........................................................ 61 9.2.2 SPORTS TRACKERS......................................................... 62 HEALTHCARE MONITORS .......................................................... 64 9.3.1 BLOOD GLUCOSE MONITORS .......................................... 68 9.3.1.1 Surge In Diabetic Population to Fuel Blood Glucose Monitor’s Sales..................................... 70 9.3.2 BLOOD PRESSURE MONITORS ........................................ 71 9.3.2.1 Increasing Cardiovascular Diseases Prevalence to Boost Wrist Wearable Blood Pressure Monitor Demand .......................................................... 72 9.3.3 HEART RATE MONITORS ................................................. 73 9.3.3.1 Unhealthy Lifestyle to Soar Market for Wrist Wearable Heart Rate Monitors ............................ 75 9.3.4 LOCATION TRACKERS ..................................................... 75 9.3.5 PULSE OXIMETER ........................................................... 77 9.3.6 WRIST WORN ANTI-SNORING DEVICES ......................... 78 9.3.7 EPILEPTIC SEIZURE MONITORS ..................................... 80 LIFESTYLE BANDS .................................................................... 81 9.4.1 SMART BANDS ............................................................... 85 9.3 9.4
9.4.2 9.4.3 INFOTAINMENT DEVICES ......................................................... 90 9.5.1 SMART WATCHES ........................................................... 93 9.5.1.1 Multi-Functional Attributes to Drive Smart Watch Sales .............................................................. 95 9.5.2 WEARABLE KEYBOARD ................................................... 96 9.5.3 WRIST WEARABLE COMPUTERS ..................................... 98 9.5.4 WRIST-WORN MUSIC PLAYERS ...................................... 99 OTHERS .................................................................................. 100 SUN EXPOSURE MONITORS ............................................ 87 WRIST CHARGERS .......................................................... 88 9.5 9.6 10WRIST WEARABLE DEVICE MARKET – BY APPLICATION .................... 103 10.1 INTRODUCTION ...................................................................... 103 10.1.1 TECHNOLOGICAL ADVANCEMENTS PROPEL THE SALES OF WRIST WEARABLE DEVICES .................................... 106 HEALTHCARE .......................................................................... 107 10.2.1 CLINICAL HEALTHCARE ................................................ 107 10.2.2 REMOTE HEALTHCARE .................................................. 108 INFORMATION CONTROL ........................................................ 108 ENTERTAINMENT .................................................................... 109 LIFESTYLE AND WELLNESS ..................................................... 110 SPORTS AND FITNESS ............................................................ 111 10.2 10.3 10.4 10.5 10.6 11WRIST WEARABLE DEVICES - GEOGRAPHIC ANALYSIS ........................ 113 11.1 AMERICAS .............................................................................. 114 11.1.1 GROWING DEMAND FOR HEALTHCARE WEARABLES SET TO PROPEL THE MARKET .............................................. 119 11.1.2 U.S ............................................................................... 120 11.1.3 CANADA ....................................................................... 120 11.1.4 BRAZIL ........................................................................ 121 EUROPE .................................................................................. 122 11.2.1 INNOVATIVE PRODUCTS AND APPLICATIONS SET TO SPUR ADOPTION OF WRIST WEARABLE DEVICES ......... 126 11.2.2 FRANCE ........................................................................ 126 11.2.3 GERMANY ..................................................................... 127 11.2.4 U.K............................................................................... 127 APAC ...................................................................................... 128 11.3.1 GROWING AWARENESS AND NEW PRODUCT LAUNCHES DRIVES PENETRATION OF WRIST WEARABLE DEVICES IN APAC ....................................................................... 131 11.3.2 CHINA .......................................................................... 132 11.3.3 JAPAN .......................................................................... 132 11.3.4 SOUTH KOREA .............................................................. 133 11.2 11.3
11.4 REST OF THE WORLD .............................................................. 133 12MARKET ENTROPY ............................................................................................ 136 12.1 12.2 12.3 12.4 12.5 MOST PREFERRED STRATEGY – PRODUCT LAUNCHES ............. 136 NEW PRODUCT LAUNCHES ...................................................... 138 MERGERS AND ACQUISITIONS ............................................... 143 AGREEMENTS & PARTNERSHIPS ............................................. 144 JOINT VENTURES .................................................................... 145 13COMPANY PROFILES ......................................................................................... 146 13.1 FITBIT INC. ............................................................................ 146 13.1.1 BUSINESS OVERVIEW .................................................. 146 13.1.2 FINANCIALS................................................................. 146 13.1.3 PRODUCTS ................................................................... 147 13.1.4 STRATEGY .................................................................... 147 13.1.5 DEVELOPMENTS ........................................................... 148 CONNECTEDEVICE LTD. .......................................................... 149 13.2.1 BUSINESS OVERVIEW .................................................. 149 13.2.2 FINANCIALS................................................................. 149 13.2.3 PRODUCTS ................................................................... 149 13.2.4 STRATEGY .................................................................... 150 13.2.5 DEVELOPMENTS ........................................................... 150 JAWBONE UP .......................................................................... 151 13.3.1 BUSINESS OVERVIEW .................................................. 151 13.3.2 FINANCIALS................................................................. 151 13.3.3 PRODUCTS ................................................................... 151 13.3.4 STRATEGY .................................................................... 152 13.3.5 DEVELOPMENTS ........................................................... 152 XIAOMI INC. ........................................................................... 154 13.4.1 BUSINESS OVERVIEW .................................................. 154 13.4.2 FINANCIALS................................................................. 154 13.4.3 PRODUCTS ................................................................... 154 13.4.4 STRATEGY .................................................................... 155 13.4.5 DEVELOPMENTS ........................................................... 155 QUALCOMM INC. ..................................................................... 156 13.5.1 BUSINESS OVERVIEW .................................................. 156 13.5.2 FINANCIALS................................................................. 156 13.5.3 PRODUCTS ................................................................... 158 13.5.4 DEVELOPMENTS ........................................................... 158 NIKE INC. ............................................................................... 159 13.6.1 BUSINESS OVERVIEW .................................................. 159 13.2 13.3 13.4 13.5 13.6
13.6.2 13.6.3 13.6.4 13.6.5 ADIDAS AG ............................................................................. 163 13.7.1 BUSINESS OVERVIEW .................................................. 163 13.7.2 FINANCIALS................................................................. 163 13.7.3 PRODUCTS ................................................................... 165 13.7.4 DEVELOPMENTS ........................................................... 165 LG ELECTRONICS INC. ............................................................ 166 13.8.1 BUSINESS OVERVIEW .................................................. 166 13.8.2 FINANCIALS................................................................. 166 13.8.3 PRODUCTS ................................................................... 168 13.8.4 DEVELOPMENTS ........................................................... 168 SONY CORP. ............................................................................ 170 13.9.1 BUSINESS OVERVIEW .................................................. 170 13.9.2 FINANCIALS................................................................. 170 13.9.3 PRODUCTS ................................................................... 171 13.9.4 DEVELOPMENTS ........................................................... 172 13.10GOOGLE INC. .......................................................................... 173 13.10.1BUSINESS OVERVIEW .................................................. 173 13.10.2FINANCIALS................................................................. 174 13.10.3PRODUCTS ................................................................... 174 13.10.4DEVELOPMENTS ........................................................... 174 13.11APPLE INC. ............................................................................. 175 13.11.1BUSINESS OVERVIEW .................................................. 175 13.11.2FINANCIALS................................................................. 175 13.11.3PRODUCTS ................................................................... 176 13.11.4DEVELOPMENTS ........................................................... 177 13.12GARMIN CORPORATION ......................................................... 178 13.12.1BUSINESS OVERVIEW .................................................. 178 13.12.2FINANCIALS................................................................. 178 13.12.3PRODUCTS ................................................................... 179 13.12.4DEVELOPMENTS ........................................................... 179 13.13METAWATCH LTD. ................................................................... 180 13.13.1BUSINESS OVERVIEW .................................................. 180 13.13.2FINANCIALS................................................................. 180 13.13.3PRODUCTS ................................................................... 180 13.13.4DEVELOPMENTS ........................................................... 181 13.14PEBBLE TECHNOLOGY CORPORATION .................................... 182 13.14.1BUSINESS OVERVIEW .................................................. 182 FINANCIALS................................................................. 159 PRODUCTS ................................................................... 161 STRATEGY .................................................................... 161 DEVELOPMENTS ........................................................... 161 13.7 13.8 13.9
13.14.2FINANCIALS................................................................. 182 13.14.3PRODUCTS ................................................................... 182 13.14.4STRATEGY .................................................................... 183 13.14.5DEVELOPMENTS ........................................................... 183 13.15MOVEA INC. ............................................................................ 184 13.15.1BUSINESS OVERVIEW .................................................. 184 13.15.2FINANCIALS................................................................. 184 13.15.3PRODUCTS ................................................................... 184 13.15.4DEVELOPMENTS ........................................................... 185 13.16RAZER INC. ............................................................................. 186 13.16.1BUSINESS OVERVIEW .................................................. 186 13.16.2FINANCIALS................................................................. 186 13.16.3PRODUCTS ................................................................... 186 13.16.4DEVELOPMENTS ........................................................... 187 13.17BASIS SCIENCE INC. ............................................................... 188 13.17.1BUSINESS OVERVIEW .................................................. 188 13.17.2FINANCIALS................................................................. 188 13.17.3PRODUCTS ................................................................... 188 13.17.4STRATEGY .................................................................... 188 13.17.5DEVELOPMENTS ........................................................... 189 13.18MISFIT WEARABLES ............................................................... 190 13.18.1BUSINESS OVERVIEW .................................................. 190 13.18.2FINANCIALS................................................................. 190 13.18.3PRODUCTS ................................................................... 190 13.18.4DEVELOPMENTS ........................................................... 191 13.19TIMEX GROUP ......................................................................... 192 13.19.1BUSINESS OVERVIEW .................................................. 192 13.19.2FINANCIALS................................................................. 192 13.19.3PRODUCTS ................................................................... 193 13.19.4DEVELOPMENTS ........................................................... 193 13.20MOTOROLA SOLUTIONS INC. .................................................. 194 13.20.1BUSINESS OVERVIEW .................................................. 194 13.20.2FINANCIALS................................................................. 194 13.20.3PRODUCTS ................................................................... 195 13.20.4DEVELOPMENTS ........................................................... 195
LIST OF TABLES UU TABLE 1. PRODUCT BENCHMARKING FOR THE TOP FIVE COMPANIES IN WRIST WEARABLE DEVICE MARKET 24 TABLE 2. PRODUCT ANALYSIS FOR THE TOP FIVE COMPANIES IN THE WRIST WEARABLE DEVICE MARKET, 2014 27 TABLE 3. GLOBAL WRIST WEARABLE DEVICES SHIPMENTS, BY COMPONENTS, 2013-2020 (MILLION UNITS) 46 TABLE 4. TABLE - GLOBAL WRIST WEARABLE DEVICES MARKET, BY COMPONENTS, 2013-2020 ($M) 47 TABLE 5. GLOBAL WRIST WEARABLE DEVICES MARKET VOLUME, BY PRODUCTS, 2013-2020 (MILLION UNITS) 55 TABLE 6. GLOBAL WRIST WEARABLE DEVICES MARKET REVENUE, BY PRODUCTS, 2013-2020 ($M) 56 TABLE 7. GLOBAL ACTIVITY TRACKERS MARKET VOLUME, BY PRODUCTS, 2013- 2020 (MILLION UNITS) 58 TABLE 8. GLOBAL ACTIVITY TRACKERS MARKET REVENUE, BY PRODUCTS, 2013- 2020 ($M) 59 TABLE 9. GLOBAL ACTIVITY TRACKERS MARKET VOLUME, BY GEOGRAPHY, 2013- 2020 (MILLION UNITS) 59 TABLE 10. GLOBAL ACTIVITY TRACKERS MARKET REVENUE, BY GEOGRAPHY, 2013- 2020 ($M) 60 TABLE 11. GLOBAL HEALTHCARE MONITORS MARKET VOLUME, BY PRODUCTS, 2013- 2020 (MILLION UNITS) 64 TABLE 12. GLOBAL HEALTHCARE MONITORS MARKET REVENUE, BY PRODUCTS, 2013-2020 ($M) 66 TABLE 13. GLOBAL HEALTHCARE MONITORS MARKET VOLUME, BY GEOGRAPHY, 2013-2020 (MILLION UNITS) 67 TABLE 14. GLOBAL HEALTHCARE MONITORS MARKET REVENUE, BY GEOGRAPHY, 2013-2020 ($M) 68 TABLE 15. GLOBAL LIFESTYLE BANDS MARKET VOLUME, BY PRODUCTS, 2013-2020 (MILLION UNITS) 82 TABLE 16. GLOBAL LIFESTYLE BANDS MARKET VOLUME, BY GEOGRAPHY, 2013-2020 (MILLION UNITS) 84 TABLE 17. GLOBAL LIFESTYLE BANDS MARKET REVENUE, BY GEOGRAPHY, 2013- 2020 ($M) 84 TABLE 18. GLOBAL INFOTAINMENT DEVICES MARKET VOLUME, BY PRODUCTS, 2013- 2020 (MILLION UNITS) 90 TABLE 19. GLOBAL INFOTAINMENT DEVICES MARKET REVENUE, BY PRODUCTS, 2013-2020 ($M) 91 TABLE 20. GLOBAL INFOTAINMENT DEVICES MARKET REVENUE, BY GEOGRAPHY, 2013-2020 ($M) 93 96 TABLE 21. TABLE 22. SMART WATCH DEVELOPMENTS-BY MANUFACTURERS GLOBAL OTHER WRIST WEARABLE DEVICES MARKET VOLUME, BY GEOGRAPHY, 2013-2020 (MILLION UNITS) 102 TABLE 23. GLOBAL OTHER WRIST WEARABLE DEVICES MARKET REVENUE, BY GEOGRAPHY, 2013-2020 ($M) 102 TABLE 24. GLOBAL WRIST WEARABLE DEVICES SHIPMENTS, BY APPLICATION, 2013- 2020 (MILLION UNITS) 104
TABLE 25. GLOBAL WRIST WEARABLE DEVICES MARKET, BY APPLICATION, 2013- 2020 ($M) 105 TABLE 26. GLOBAL WRIST WEARABLE DEVICES MARKET, BY APPLICATION, 2013- 2020 (%) 106 TABLE 27. GLOBAL WRIST WEARABLE DEVICES SHIPMENTS, BY GEOGRAPHY, 2013- 2020 (MILLION UNITS) 113 TABLE 28. GLOBAL WRIST WEARABLE DEVICES MARKET, BY GEOGRAPHY, 2013-2020 ($M) 113 AMERICAS WRIST WEARABLE DEVICES SHIPMENTS, BY GEOGRAPHY, 2013-2020 (MILLION UNITS) TABLE 29. 115 TABLE 30. AMERICAS WRIST WEARABLE DEVICES MARKET, BY GEOGRAPHY, 2013- 2020 ($M) 116 TABLE 31. AMERICAS WRIST WEARABLE DEVICES SHIPMENTS, BY PRODUCT, 2013- 2020 (MILLION UNITS) 118 TABLE 32. AMERICAS WRIST WEARABLE DEVICES MARKET, BY PRODUCT, 2013-2020 ($M) 119 EUROPEAN WRIST WEARABLE DEVICES SHIPMENTS, BY GEOGRAPHY, 2013-2020 (MILLION UNITS) TABLE 33. 122 TABLE 34. EUROPEAN WRIST WEARABLE DEVICES MARKET, BY GEOGRAPHY, 2013- 2020 ($M) 123 TABLE 35. EUROPEAN WRIST WEARABLE DEVICES SHIPMENTS, BY PRODUCT, 2013- 2020 (MILLION UNITS) 124 TABLE 36. EUROPEAN WRIST WEARABLE DEVICES MARKET, BY PRODUCT, 2013-2020 ($M) 125 APAC WRIST WEARABLE DEVICES SHIPMENTS, BY GEOGRAPHY, 2013- 2020 (MILLION UNITS) TABLE 37. 128 TABLE 38. APAC WRIST WEARABLE DEVICES MARKET, BY GEOGRAPHY, 2013-2020 ($M) 129 APAC WRIST WEARABLE DEVICES SHIPMENTS, BY PRODUCT, 2013-2020 (MILLION UNITS) TABLE 39. 130 131 TABLE 40. TABLE 41. APAC WRIST WEARABLE DEVICES MARKET, BY PRODUCT, 2013-2020 ($M) ROW WRIST WEARABLE DEVICES SHIPMENTS, BY PRODUCT, 2013-2020 (MILLION UNITS) 134 134 139 TABLE 42. TABLE 43. TABLE 44. ROW WRIST WEARABLE DEVICES MARKET, BY PRODUCT, 2013-2020 ($M) GLOBAL WRIST WEARABLE DEVICE MARKET: KEY PRODUCT LAUNCHES GLOBAL WRIST WEARABLE DEVICES MARKET: KEY MERGERS & ACQUISITIONS 143 TABLE 45. GLOBAL WRIST WEARABLE DEVICES MARKET: KEY AGREEMENTS & PARTNERSHIPS 144 145 157 160 164 TABLE 46. TABLE 47. TABLE 48. TABLE 49. TABLE 50. GLOBAL WRIST WEARABLE MARKET: KEY JOINT VENTURES QUALCOMM INC.: TOTAL REVENUE, BY REGION, 2012 – 2013 ($BN) NIKE INC.: TOTAL REVENUE, BY SEGMENTS, 2013 – 2014 ($BN) ADIDAS AG: TOTAL REVENUE, BY SEGMENTS, 2012 – 2013 ($BN) LG ELECTRONICS INC. TOTAL REVENUE, BY SEGMENTS, 2012 – 2013 ($BN) 167 174 176 176 TABLE 51. TABLE 52. TABLE 53. GOOGLE INC.: TOTAL REVENUE, 2010– 2013 ($BN) APPLE INC.: REVENUE BY SEGMENTS, 2013– 2014 ($BN) APPLE INC.: REVENUE BY GEOGRAPHY, 2013– 2014 ($BN)
TABLE 54. TABLE 55. GARMIN CORP.: REVENUE BY SEGMENTS, 2012– 2013 ($M) 178 179 GARMIN CORP.: REVENUE BY GEOGRAPHY, 2012– 2013 ($M)
1 LIST OF FIGURES GLOBAL WRIST WEARABLE DEVICES MARKET SHARE, BY PRODUCT, 2014 (%) 19 GLOBAL WRIST WEARABLE DEVICES MARKET, 2014 AND 2020 ($M) FIGURE1. 20 22 FIGURE2. GLOBAL WRIST WEARABLE DEVICES MARKET SHARE ANALYSIS, 2014 (%) FIGURE3. GLOBAL WRIST WEARABLE DEVICES MARKET, BY END USE INDUSTRY, 2014 (%) FIGURE4. 25 37 38 39 GLOBAL WRIST WEARABLE DEVICES PRODUCT LIFE CYCLE ANALYSIS FIGURE5. GLOBAL WRIST WEARABLE DEVICES PRODUCT LIFE CYCLE ANALYSIS FIGURE6. GLOBAL WRIST WEARABLE DEVICES MARKET LIFE ANALYSIS FIGURE7. GLOBAL WRIST WEARABLE DEVICES MARKET, BY COMPONENTS, 2014 (%) 48 GLOBAL WRIST WEARABLE DEVICES MARKET VOLUME SHARE, BY PRODUCTS, 2014 (%) FIGURE8. FIGURE9. 56 GLOBAL WRIST WEARABLE DEVICES MARKET REVENUE SHARE, BY PRODUCTS, 2014 (%) FIGURE10. 57 GLOBAL FITNESS TRACKERS MARKET VOLUME, BY YEARS, 2013-2020 (MILLION UNITS) FIGURE11. 61 GLOBAL FITNESS TRACKERS MARKET REVENUE, BY YEARS, 2013-2020 ($M) 61 GLOBAL SPORTS TRACKERS MARKET VOLUME, BY YEARS, 2013-2020 (MILLION UNITS) FIGURE12. FIGURE13. 63 GLOBAL SPORTS TRACKERS MARKET REVENUE, BY YEARS, 2013-2020 ($M) 63 GLOBAL HEALTHCARE MONITORS MARKET VOLUME SHARE, BY PRODUCTS, 2014 (%) FIGURE14. FIGURE15. 65 GLOBAL HEALTHCARE MONITORS MARKET REVENUE SHARE, BY PRODUCTS, 2014 (%) FIGURE16. 67 GLOBAL BLOOD GLUCOSE MONITORS MARKET VOLUME, BY YEARS, 2013- 2020 (MILLION UNITS) FIGURE17. 69 GLOBAL BLOOD GLUCOSE MONITORS MARKET REVENUE, BY YEARS, 2013-2020 ($M) FIGURE18. 69 GLOBAL ESTIMATE OF PEOPLE SUFFERING FROM DIABETES, BY REGIONS, 2013 & 2035 (IN MILLIONS) FIGURE19. 70 GLOBAL BLOOD PRESSURE MONITORS MARKET VOLUME, BY YEARS, 2013-2020 (MILLION UNITS) FIGURE20. 71 GLOBAL BLOOD PRESSURE MONITORS MARKET REVENUE, BY YEARS, 2013-2020 ($M) FIGURE21. 72 GLOBAL ESTIMATION OF DEATHS DUE TO CARDIOVASCULAR DISEASES, BY YEARS (%) FIGURE22. 73 GLOBAL HEART RATE MONITORS MARKET VOLUME, BY YEARS, 2013-2020 (MILLION UNITS) FIGURE23. 74 GLOBAL HEART RATE MONITORS MARKET REVENUE, BY YEARS, 2013- 2020 ($M) FIGURE24. 74 GLOBAL LOCATION TRACKERS MARKET VOLUME, BY YEARS, 2013-2020 (MILLION UNITS) FIGURE25. 76
GLOBAL LOCATION TRACKERS MARKET REVENUE, BY YEARS, 2013-2020 ($M) 76 GLOBAL PULSE OXIMETERS MARKET VOLUME, BY YEARS, 2013-2020 (MILLION UNITS) FIGURE26. FIGURE27. 77 GLOBAL PULSE OXIMETERS MARKET REVENUE, BY YEARS, 2013-2020 ($M) 78 GLOBAL WRIST WORN ANTI-SNORING DEVICES MARKET VOLUME, BY YEARS, 2013-2020 (MILLION UNITS) FIGURE28. FIGURE29. 79 GLOBAL WRIST WORN ANTI-SNORING DEVICES MARKET REVENUE, BY YEARS, 2013-2020 ($M) FIGURE30. 79 GLOBAL EPILEPTIC SEIZURE MONITORS MARKET VOLUME, BY YEARS, 2013-2020 (MILLION UNITS) FIGURE31. 80 GLOBAL EPILEPTIC SEIZURE MONITORS MARKET REVENUE, BY YEARS, 2013-2020 ($M) FIGURE32. 81 GLOBAL LIFESTYLE BANDS MARKET VOLUME SHARE, BY PRODUCTS, 2014 (%) 82 GLOBAL LIFESTYLE BANDS MARKET REVENUE, BY PRODUCTS, 2013-2020 ($M) 83 GLOBAL LIFESTYLE BANDS MARKET REVENUE SHARE, BY PRODUCTS, 2014 (%) FIGURE33. FIGURE34. FIGURE35. 83 GLOBAL SMART BANDS MARKET VOLUME, BY YEARS, 2013-2020 (MILLION UNITS) FIGURE36. 85 86 GLOBAL SMART BANDS MARKET REVENUE, BY YEARS, 2013-2020 ($M) FIGURE37. GLOBAL SUN EXPOSURE MONITORS MARKET VOLUME, BY YEARS, 2013- 2020 (MILLION UNITS) FIGURE38. 87 GLOBAL SUN EXPOSURE MONITORS MARKET REVENUE, BY YEARS, 2013- 2020 ($M) FIGURE39. 88 GLOBAL WRIST CHARGERS MARKET VOLUME, BY YEARS, 2013-2020 (MILLION UNITS) FIGURE40. 89 89 GLOBAL WRIST CHARGERS MARKET REVENUE, BY YEARS, 2013-2020 ($M) FIGURE41. GLOBAL INFOTAINMENT DEVICES MARKET VOLUME SHARE, BY PRODUCTS, 2014 (%) FIGURE42. 91 GLOBAL INFOTAINMENT DEVICES MARKET REVENUE SHARE, BY PRODUCTS, 2014 (%) FIGURE43. 92 GLOBAL INFOTAINMENT DEVICES MARKET VOLUME, BY GEOGRAPHY, 2013-2020 (MILLION UNITS) FIGURE44. 92 GLOBAL SMART WATCHES MARKET VOLUME, BY YEARS, 2013-2020 (MILLION UNITS) FIGURE45. 94 94 GLOBAL SMART WATCHES MARKET REVENUE, BY YEARS, 2013-2020 ($M) FIGURE46. GLOBAL SMART WATCH SALES, BY MANUFACTURERS, 2013 (IN ‘000 UNITS) FIGURE47. 95 GLOBAL WEARABLE KEYBOARD MARKET VOLUME, BY YEARS, 2013-2020 (MILLION UNITS) FIGURE48. 97 GLOBAL WEARABLE KEYBOARD MARKET REVENUE, BY YEARS, 2013-2020 ($M) 97 GLOBAL WRIST WEARABLE COMPUTERS MARKET VOLUME, BY YEARS, 2013-2020 (MILLION UNITS) FIGURE49. FIGURE50. 98 GLOBAL WRIST WEARABLE COMPUTERS MARKET REVENUE, BY YEARS, 2013-2020 ($M) FIGURE51. 98
GLOBAL WRIST-WORN MUSIC PLAYERS MARKET VOLUME, BY YEARS, 2013-2020 (MILLION UNITS) FIGURE52. 99 GLOBAL WRIST-WORN MUSIC PLAYERS MARKET REVENUE, BY YEARS, 2013-2020 ($M) FIGURE53. 100 GLOBAL OTHER WRIST WEARABLE DEVICES MARKET VOLUME, BY YEARS, 2013-2020 (MILLION UNITS) FIGURE54. 101 GLOBAL OTHER WRIST WEARABLE DEVICES MARKET REVENUE, BY YEARS, 2013-2020 ($M) GLOBAL WRIST WEARABLE DEVICES MARKET, BY GEOGRAPHY, 2014 (%) FIGURE55. 101 114 FIGURE56. AMERICAS WRIST WEARABLE DEVICES MARKET, BY GEOGRAPHY, 2014 (%) 117 EUROPE WRIST WEARABLE DEVICES MARKET, BY GEOGRAPHY, 2014 (%) FIGURE57. 124 129 FIGURE58. APAC WRIST WEARABLE DEVICES MARKET, BY GEOGRAPHY, 2014 (%) FIGURE59. GLOBAL WRIST WEARABLE DEVICES MARKET, BY TYPE OF DEVELOPMENT, 2012-2014 FIGURE60. 136 GLOBAL WRIST WEARABLE DEVICES MARKET – M&A'S, COLLABORATIONS, JV'S & PARTNERSHIPS, BY NUMBER OF DEVELOPMENTS, 2012 – 2014 FIGURE61. 137 138 GLOBAL WRIST WEARABLE DEVICE PRODUCT LAUNCHES, 2012-2014 (%) FIGURE62. GLOBAL WRIST WEARABLE PRODUCT LAUNCHES, BY KEY PLAYERS, 2012- 2014 FIGURE63. 139 157 160 164 167 171 194 QUALCOMM INC. TOTAL REVENUE, BY SEGMENTS, 2013 (%) FIGURE64. FIGURE65. NIKE INC. TOTAL REVENUE, BY REGION, 2014 (%) ADIDAS AG.: TOTAL REVENUE, BY REGION, 2013 (%) FIGURE66. LG ELECTRONICS INC.: TOTAL REVENUE, BY REGION, 2013 (%) FIGURE67. SONY CORP. TOTAL REVENUE, BY SEGMENTS, 2013 (%) FIGURE68. MOTOROLA SOLUTIONS INC.: TOTAL REVENUE, BY REGION, 2013 (%) FIGURE69. FIGURE: MOTOROLA SOLUTIONS INC.: TOTAL REVENUE, BY SEGMENT, 2012 – 2013 ($BN) FIGURE70. 195
2MARKET OVERVIEW 2.1 GLOBAL WRIST WEARABLE DEVICES MARKET OVERVIEW Wearable devices are new forms of electronic technologies that can encompass several accessories and clothing capable of digital computation and comfortably be worn on body. The wearable devices incorporates various devices including smart watch, smart glass, health monitoring bands, activity trackers, smart clothing and many others. The wrist wearable devices refer to the specific category of devices in the wearable devices market that can be worn on the wrist. These devices are battery operated devices with various sensors integrated into them for carrying out specific monitoring and tracking activities. The eminent examples in this category include smart watch, fitness bands, sports trackers, blood pressure monitor, pulse oximeters and so on. 2.2 GLOBAL WRIST WEARABLE DEVICES TIMELINE 2014 2013 Intorduction of niche products including wrist weararble music players, video recorders, wrist chargers and many others. Jawbone upgraded its product UP to UP 24 for wireless connectivity by syncing Bluetooth while other players such as Fitbit, Misfit and Polar kept on launching fitness bands with new functionalities. 2007 FitBit launched fitness band in the global wearable market. 1999 Samsung introduced world's first watch phone. 1975 Launch of the first wrist wearable calculator wrist watch. SOURCE: IndustryARC Analysis The wrist wearable devices have been pioneers in the wearable devices market with first wearable calculator wrist watch launched by Pulsar in 1975. Since then, electronic manufacturing
technology has advanced greatly, enabled by the development in Micro-Electrical Mechanical System (MEMS). This facilitated the production of electronic components at micro levels. The most notable being the reduction in the size of notable sensors including accelerometers, gyroscopes and several other body sensors which simultaneously led to the designing of wrist wearable devices. In 1999, Samsung launched an early version of smart watch in the form of watch phone that was capable of operating basic communication functions of a cellular phone. As the technology for creating electronic components and their integration technique such as Very Large Scale Integration (VLSI) has progressed further, many companies such as Fitbit, Misfit and Jawbone entered the market with unique product offerings between 2007 and 2013. The product offerings from the companies in the market have been unique at competitive prices with the capability of monitoring different health parameters and tracking routine activities. 2014 had been a remarkable year for wrist wearable devices. The market witnessed many emerging applications including wrist wearable music players, wrist–mounted battery chargers, sun exposure monitors, video recorders, anti-snoring devices and many others. 2.3 CLASSIFICATION The report covers a detailed overview of the wrist wearable devices market by segmenting on three key parameters: products, applications and geography. These segments are further classified to provide an exhaustive overview of the market. 2.3.1 WRIST WEARABLE DEVICES - BY PRODUCTS Based on the products, wrist wearable devices market has been classified into the following: • Activity trackers • Healthcare monitors • Lifestyle bands • Infotainment devices • Others. Activity Trackers refers to wrist wearable devices that are utilized for tracking various fitness and sports performance parameters such as strokes, paddles, distance and maximum g-force and so on. This category includes sports and fitness trackers that can be comfortably worn on wrist. The next category is Healthcare monitors capable of monitoring diverse health conditioning
parameters such as blood glucose, blood pressure, oxygen levels and heart rate. Some eminent wrist wearable healthcare monitors included in this category are Blood Pressure Monitors, Blood Glucose Monitors, Pulse Oximeters and Heart rate Monitors. Following this, are Lifestyle bands comprising of smart bands or fitness bands commonly employed for tracking routine activities such as sleep duration and its quality, distance travelled and calories burnt. The succeeding category includes Infotainment devices consisting of smart watches that are becoming a significant accessory to smart phones for information and entertainment control. The last segment denoted as others encompasses all the devices that are new entrants in the market or are in a nascent phase in the global wrist wearable devices market. This segment contains various devices including location trackers, wrist chargers, wrist wearable computer and so on. 2.3.2 WRIST WEARABLE DEVICES-BY APPLICATIONS The next classification of the market is based on the applications for wrist wearable devices. The applications covered in the report include: • Healthcare • Information Control • Entertainment • Lifestyle & Wellness • Sports & Fitness The Healthcare sector covers the usage of these devices in both remote and clinical healthcare for monitoring health conditions followed by information control. Information Control deals with the utilization of wrist wearable devices as information control equipment or remote operation of device such as smart phones and tablets. The succeeding category is Entertainment, which is concerned with the use of wrist wearable devices for streaming media content followed by lifestyle & wellness. It is involves the use of devices for tracking daily activities such as sleep, distance and calorie intake. The last category includes Sports and Fitness where wrist wearable devices are incorporated by users for inspecting several performance parameters. 2.3.3 WRIST WEARABLE DEVICES-BY GEOGRAPHY The last segment classifies the wrist wearable devices market based on world geographic regions which are further classified into eminent countries. • Americas
• Europe • Asia-Pacific (APAC) • RoW The first segment is Americas covering the market in both North America and South America continent. This category covers Brazil, Canada and U.S. markets followed by Europe encompassing Germany, France and U.K. markets. The succeeding geography included Asia-Pacific region comprising of China, Japan and South Koreas as notable markets. The last category denoted as Rest of the World (RoW) contains the market for other fragmented regions including African and Commonwealth of Independent States (CIS) countries.
3EXECUTIVE SUMMARY The wrist wearable devices refer to a subcategory of wearable devices market that can be worn on the wrist. These devices provide numerous applications and have found increased adoption in recent years. IndustryARC estimates global wrist wearable device market size for 2014 to be around $11.5 billion. Wrist wearable device market is forecast to exhibit a growth rate of 19.2% through 2020 and reach $35.8 billion. The growth of wrist wearable device market can be attributed to the growing applications, as well as technological advancements leading to increased features on these devices. The growing awareness regarding wrist wearable devices is projected to spur the market. Wrist wearable device market has been segmented based on type of product used into activity trackers, healthcare monitors, infotainment devices, lifestyle bands and others. The Infotainment devices segment is forecast to exhibit significant growth due to growing awareness as leading consumer electronics companies enter the market. FIGURE1.GLOBAL WRIST WEARABLE DEVICES MARKET SHARE, BY PRODUCT, 2014 (%) xx xx xx Infotainment Devices Others Source: IndustryARC Analysis, Expert Insights xx is the dominant market with a total market size of $xx billion in 2014. xx are the fastest growing segment with a market size of $xx m in 2014 and estimated to grow at a CAGR of 52.2% through 2020. xx are also projected to exhibit high growth of 34.2% through 2020 to reach $14.4 billion.
Major growth in wrist wearable device market is projected from xx and xx segment due to growing health concerns leading to increased demand for these devices. xx segment is projected to be the biggest market through 2020. xx is projected to exhibit significant growth to reach $xx billion by 2020 with the highest volume growth forecast for this segment. The growing numbers of applications, technological advancements as well as growing awareness in APAC region regarding this market are the major drivers in the wrist wearable device market. FIGURE2.GLOBAL WRIST WEARABLE DEVICES MARKET, 2014 AND 2020 ($M) xx xx $Million xx xx xx xx - 2014 2020 Source: IndustryARC Analysis, Expert Insights xx is the biggest market for Wrist wearable devices, accounting for xx % of the market in 2014. xx account for 0.2% of the market but are estimated to be the fastest growing segment. The growth of the xx bands market is due to increased demand and growing functionalities offered by these devices. xx is the largest market for Wrist Wearable systems followed by xx The lower growth of these devices when compared with xx is due to smaller untapped market in these regions when compared with xxmarket. The continued effects of recession in xx are projected to be a hindrance for wrist wearable device growth in Europe. xx region is the fastest growing market and is forecast to outgrow xx by 2019. The high growth in this region is due to growing awareness and improved economic conditions leading to increased demand for wrist wearable devices.
The major players in this market are xx ., xx , Nike Inc., Pebble Technology Inc. and Basis Science Inc. The major recent acquisition in this market is that of Basis by Intel. Basis is one of the leading players in this market and intends to leverage Intel's technological capabilities to enhance its product portfolio with innovative products. Intel enters into the wrist wearable device market with this acquisition. Wrist Wearable device manufacturers have utilized mergers and acquisitions as well as product launches to augment entry into related markets and enhance core competencies through additions to product portfolio as well as leveraging capabilities of acquired companies to gain a foothold in high growth markets. The product launches have played a key role in the growth of the major players as a whole, as the growing demand for connected wrist wearable devices both in technological features as well as aesthetic design propels the companies to invest into R&D. Companies have also focused on R&D and innovation of new products to enter the growing wrist wearable devices market from related consumer electronics and smartphone markets.
devices enabling technology. The amalgamation of aforementioned factors will be influential for wrist wearable devices market and fuelling their expansion across the globe. 5.2 MARKET CONSTRAINTS 5.2.1 EXORBITANT PRICES OF DEVICES RESTRAIN FULL-FLEDGED MARKET GROWTH The initial costs for the wrist wearable devices are generally high with prices ranging between $xx and $xx. The costs vary depending on the type of wrist wearable devices, for example fitness bands average selling price ranges between $xx and $xx while a smart watch may cost over $xx. The prices also vary depending upon the functionality being integrated by device manufacturers. These variable costs act as constraints for mass adoption of wrist wearable devices globally. Although, due to influx of large number of original device manufacturers, costs of wrist wearable devices particularly fitness bands have declined but to remain competitive in the market but manufacturers are keen on assembling specific sensors to create an exclusive product that adds up to the cost of wrist wearable devices significantly and therefore, impacting their affordability for wide-scale adoption. 5.2.2 DESIGN COMPLEXITIES AFFECTING USER’S PREFERENCE Currently, the wrist wearable devices manufacturers rely upon the technology being utilized for smartphones for the fabrication of wrist wearable devices. The sensors and processors used for these devices are completely based upon the fabrication techniques employed for integration into smartphones and other consumer electronics accessories. This factor limits the flexibility in designs of wrist wearable devices. The wrist wearable devices has become a part of personal identity reflecting fashion trends of users but manufacturers are more focused on integrating multiple technologies on a single platform instead of creating a new design to address multiple functionalities in wearable devices. The prominent example being the smart watches where manufacturers in order to comply with several functionalities of smartphones compromise on design that increases the size of smart watches and are not able to reflect users fashion preference which restrains the market from a bolstering growth 5.2.3 LOW SUSTAINABILITY IMPACTING GROWTH POTENTIAL The wrist wearable devices due to their association as a personal item reflecting social status of the user are prone to low retention rates. These retention rates are highly affected by the type of
wrist wearable devices and the frequent product launches by manufacturers with advanced functionalities. The wrist wearable devices particularly fitness bands and activity trackers have retention periods between six months and one year while smart watches generally exist for longer periods ranging between 2 years and 3 years. Due to lack of data perspective in fitness bands and activity trackers users get easily bored with these devices and impacts their service life while smart watches with high cost tend to serve the user for longer periods. Moreover, frequent product launches with advanced functionalities impact the user’s behaviour to opt for current wrist wearable devices. A lot of start-ups enabled by crowd funding in the field of activity trackers and fitness bands have reduced their retention life. The users affected by the new functionalities in the current devices tend to prefer them, thus making the existing wrist wearable devices obsolete and create obstruction for the wrist wearable devices market to realize its full potential. 5.3 MARKET CHALLENGES 5.3.1 DATA PRIVACY & SECURITY ISSUES TO DAMPEN MARKET GROWTH The wrist wearable devices store a large amount of sensitive data about the user. The data may vary from the health conditions to the user’s location. In case, if these devices are misplaced or lost, the data of the user is prone to be hacked that can cause disruption in the device operation and their further likeability for mass adoption. Also, as most of the wrist wearable devices are now being integrated with global Positioning Systems (GPS), the user’s location information is easily shared by them that can be retrieved by advertisers with ease. Most of the user’s location data is controlled by respective network operators that include mobile content providers, thus raising concerns for the users about their privacy. All these factors raises serious issues with the utilization of wrist wearable devices appropriately that may dampen the consumers’ confidence and thereby, affecting the market growth of the devices. 5.3.2 RELIABILITY & ACCURACY OF A DEVICE POSES CONCERN The wrist wearable devices integrate miniature sensors that pose challenge in terms of data accuracy and reliability. Although, these sensors are low-cost that facilitate the production of inexpensive wrist wearable devices but they are less reliable significantly in linearity, drift and offset. Although the errors arising due to aforementioned three factors can be reduced by calibration but this process is expensive and does not address the problem with drift entirely. The prominent example includes the offset and drift errors in accelerometer. The offset error in
efficient. Ineda Systems, on the similar lines also created a low-processor chip for its integration into wearable products. The technical advancements such as low-power connectivity, low-power processors, configurable and flexible processing are offering new potential areas for suppliers to focus on. 7.2 TESTING, INSPECTION & CERTIFICATION BODIES 7.2.1 INTRODUCTION 2014 had been a remarkable year for wearable technology, witnessing multitude of wearable devices launched in the market. The manufacturers launched several smart wearable devices that can be worn on various parts of a human body including wrist, eyes, head, ankles and many others. The most prominent developments were witnessed in the wrist wearable devices that ranged from lifestyle bands, activity trackers, health monitors and smart watches. As wrist wearable device market has been witnessing emerging applications, the market players are experiencing few barriers in the form of overall product quality and infringement of patents. The notable example include the voluntary recall of a fitness band, Fitbit Force by Fitbit as consumers experienced allergic reactions due to the material of the band. This has called for the standardization of regulations for testing and inspection of wearable devices. 7.2.2 TYPES Wrist Wearable devices are intended for daily use under diverse conditions. These devices need to be evaluated on certain parameters including compliance of national regulatory standards, product safety and its performance along with a pleasant user experience. To ensure product safety and assured performance wrist wearable device manufacturers require their products to go through three phases of validation: testing, inspection & certification. 7.2.3 TESTING Testing for wrist wearable devices is generally done to check performance parameters of the product. The parameters differ on both wearable function and smart function levels. Wearable function evaluation deals with the external testing of the device comprising of design aesthetics, material testing, ingress protection testing, wireless antenna performance and battery life testing. Smart function evaluation is feasible for the embedded electronic components particularly
TABLE 12.GLOBAL HEALTHCARE MONITORS MARKET REVENUE, BY PRODUCTS, 2013-2020 ($M) Healthcare 2013 2014 2015 2016 2018 2019 2020 CAGR% Monitors (2015 - 2020) Blood Glucose Monitor Blood Pressure Monitors Heart Rate Monitors Location Tracker Pulse Oximeters Wrist-Worn Anti- Snoring Device Epileptic Seizures Monitors Total 10.4% SOURCE: IndustryARC Analysis, Expert Insights The net market revenue of the xx in 2014 was worth $xx billion in 2014. Owing to the significant market shipments of pulse oximeters, its revenue contributed notably followed by xx. The total market revenue for xx xx across the globe is forecast to increase from $xx billion in 2015 to $xx billion by 2020 at a CAGR of 10.4%.
shipments for wrist wearable healthcare monitors increasing from xx m units in 2015 to xx m units by 2020 at a CAGR of xx %. xx region boosted by its high economic growth will enable the people to possess these devices in order to lead a healthy life, thus taking the market volume for wrist wearable healthcare monitors from xx m units in 2015 to xx m units by 2020 with a CAGR of xx%. TABLE 14.GLOBAL HEALTHCARE MONITORS MARKET REVENUE, BY GEOGRAPHY, 2013-2020 ($M) Healthcare 2013 2014 2015 2016 2017 2019 2020 CAGR% Monitors (2015 - 2020) Americas Europe APAC RoW Total 8539.3 8843.3 9434.4 10997.9 12384.8 14628.6 15485.6 10.4% SOURCE: IndustryARC Analysis, Expert Insights xx and xx were the top contenders for net market revenue of wrist wearable healthcare monitors in 2014. The market revenue for wrist wearable xx in xx is forecast to rise from $xx billion in 2015 to $xx billion by 2020 at a CAGR of 5.3%. xx for the same product will have its revenue up surging from $2.3 billion in 2015 to $5.5 billion by 2020 with a CAGR of 18.5%. 9.3.1 BLOOD GLUCOSE MONITORS Wrist Wearable Blood Glucose Monitors are devices that examine the glucose levels in the blood periodically due to the absence of required levels of insulin. The high concentration of glucose in the blood leads to diabetes, a major contributor to the deaths among the deaths occurring due to communicable and non-communicable diseases across the globe. Blood Glucose Monitors are compatible with both Type 1 and Type 2 diabetes. This category of device is being extensively researched upon in order to create a non-invasive technology that can detect blood glucose levels based on calorie intake. The latest development in the category includes the development of wrist worn blood glucose monitor by a start-up called GoBe. The device from the company utilizes bio- impedance senor to measure water balance in the body and build glucose curves.
13.8LG ELECTRONICS INC. Headquarters: LG Twin Tower 128, Yeoui-daero, Yeongdeungpo-gu, Seoul, South Korea Tel: +82-2-3777-1114 Website: www.lg.com 13.8.1 BUSINESS OVERVIEW LG Electronics Inc. (U.S.) was founded in 1958 in Seoul, South Korea. LG is a leading manufacturer of consumer electronics including smartphones. LG was founded in 1958 as GoldStar and the name was changed to LG in 1995. LG has five segments of operation, namely; home entertainment (HE), mobile communication (MC), home appliance (HA), air conditioning & energy solutions (AE) and vehicle components. The mobile communication segment consists of various mobiles, tablets, mobile accessories and smartwatches. Wrist Wearable devices fall under this segment. LG has 87,000 employees as of May, 2014. LG has operations in over 80 countries including India, China, U.S., Germany and U.K. The key competitors include Panasonic Corp. (Japan), Sony Corp. (Japan) and Samsung Electronics Corp. (South Korea). 13.8.2 FINANCIALS LG generated revenue of $54.7 billion in 2013. This was effective for a 6% rise over the 2012 revenue of $51.6 billion. This growth was due to increased revenue of mobile communications segment and air conditioning segment.
FIGURE67.LG ELECTRONICS INC.: TOTAL REVENUE, BY REGION, 2013 (%) 20% 25% South Korea North America Europe 7% Middle East and Africa Rest of APAC 3% India 6% 20% China 8% ROW 11% Source: Company Website, Annual Report South Korea was the leading region accounting for 25% of total revenue of LG in 2013. This was a growth of 6.5% over 2012 revenue due to high growth in mobile communications segment. The North American segment accounted for 20% of the revenue in 2013 and was a 2.7% growth over 2012 revenue. India and Rest of APAC segments accounted for 3% and 6%, of the revenue respectively. These segments fell by 3% and 5%, respectively. TABLE 50.LG ELECTRONICS INC. TOTAL REVENUE, BY SEGMENTS, 2012 – 2013 ($BN) Segments HE MC HA AE Innotek Source: Company Website, Annual Report 2012 $20.9 $9.4 $10.5 $4.0 $5.0 2013 $19.9 $12.2 $11.1 $4.4 $5.8 The Home Entertainment segment accounted for revenue of $19.9 billion in 2013 and fell by 4.8% from 2012. Home Appliance division accounted total revenue of $11.1 billion in 2013. Air Conditioning and Energy Services segment generated revenue of $4.4 billion in 2013. These segments grew by 5.7% and 10%, respectively from 2012. Mobile Communications segment accounted for revenue of $12.2 in 2014 and grew by 29.8% from 2012. The increased sale of wearable devices, mobiles and tablets has contributed for this revenue growth.
13.8.3 PRODUCTS LG provides various consumer electronics including wrist wearable devices. Segmentation Product type Product Name Application Mobile Smartwatch G Watch Connected Features, Communications Navigation capabilities, fitness tracking G Watch R High precision, Connected Features, Navigation capabilities, fitness tracking Source: Company Website, Press Releases 13.8.4 DEVELOPMENTS Date Approach Description November, 2014 Agreement LG and Google has entered into a licensing agreement for the next ten years. This agreement covers a number of products and technologies. LG intends to leverage Google’s software development capabilities to launch innovative products especially in the mobile communications segment with focus on leveraging Google’s Android Wear software in its wearable devices. October, 2014 Product Launch LG launched the LG G Watch R E, the latest version of its
smart watch. This new product has increased connectivity and fitness tracking features. July, 2014 Product Launch LG launched G Watch in order to gain foothold in the growing fitness tracking devices market. LG entered this market with the launch of G Watch. Source: Company Website, Press Releases
THE ARC ADVANTAGE An analytical model lies at the core of our process, ensuring logical consistency throughout our research. We complement the model with secondary data and interviews with industry experts to reflect the latest trends. With our final expert validation, we provide you with only the most accurate and actionable intelligence. THE ARC PROCESS Base Method Analytical Method Consolidation Method Delphi Verification 1. Granular breakdown of drivers into factors 2. Validate all factors in terms of their present impact on the market 3. Assign weights to these factors in terms of their relevance and impact on the market 4. Build the Analytical Model 1. Get a top- down estimate of the market 2. Follow it up with a bottom-up estimate of the market 3. Check forconsistency and new growth factors that are relevant over the next 10 Years 4. Build the Base model 1. Granular breakdown of drivers into factors 2. Validate all factors in terms of their present impact on the market. 3. Assign weights to these factors in terms of their relevance and impact on the market. 4. Build the Consolidated Model 1. Verify the findings of the model with experts from across the value chain 2. Verify the findings with players across small and large enterprises 3. Tweak the model and add new factors 4. Finalize the ARC Model ANALYTICAL MODEL BASE MODEL CONSOLIDATED MODEL ARC MODEL
ABOUT US IndustryARC was started by a group of young, passionate professionals along with extensively experienced industry veterans across various business segments. Our focus and expertise is mainly in the field of analytics, market research and consulting. Our singular goal is to provide accurate and affordable research to our clients. Our research team has expertise in diverse fields like Automotive, Chemicals,Consumer Product & Services, Electronics, Food & Beverages, Healthcare etc., However diverse the expertise maybe, everyone in our team shares one common trait - we love data and we love providing solutions to clients using that data even more! Seeing your business flourish based on our solutions and strategy is what we love the most! IndustryARC publishes more than 30 reports on an annual basis in the mentioned Industries. Our reports are in-depth and high quality reports that can help decision makers frame better strategies for their business requirements. These reports can be further customized as per your needs. Disclaimer: •The reports sold by IndustryARC are limited publications containing valuable market information provided to a select group of customers in response to orders. •Our customers acknowledge and agree that any report bought from IndustryARC is for their own internal use and not for general publication or disclosure to third parties. •Our reports or part of the reports, information contained in the report, cannot be shared or resold to any other third party. •Disclosure to third parties, usage of data in a public document, article or blog by the customer can be done with prior permission taken from IndustryARC. For information regarding permissions and sales, contact: sales@industryarc.com | sanjay.matthews@industryarc.com
IndustryARC +1 614 - 588 - 8538 sales@industryarc.com Copyright ©2015 IndustryARC All Rights Reserved. This document contains highly confidential information and is the sole property of IndustryARC. No part of it may be circulated, copied, quoted, or otherwise reproduced without the approval of IndustryARC.