Download
1 / 19
200 likes | 394 Views
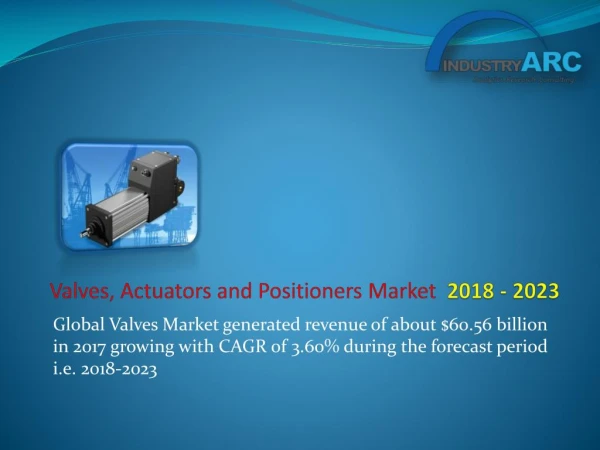
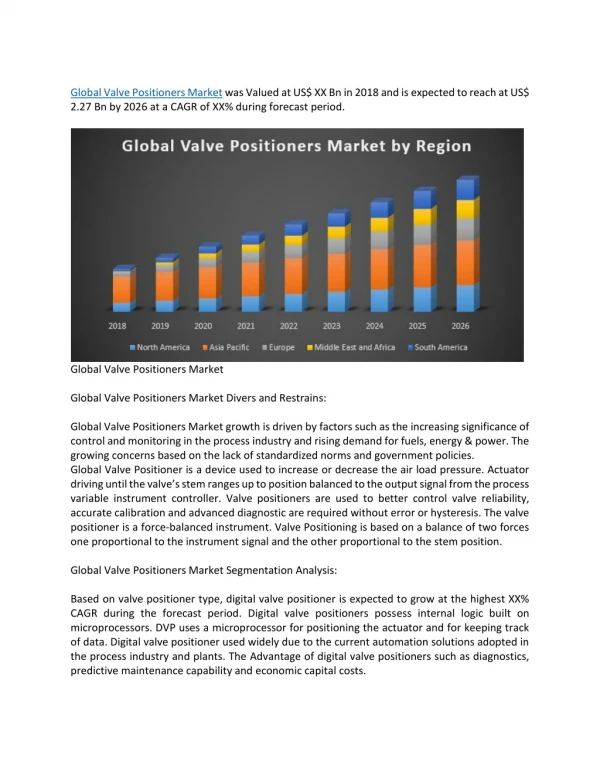
According to a recent report by IndustryARC, the overall market for Valves, Actuators and Positioners was around $36 billion in 2014. The cumulative market is estimated to grow with a CAGR of 3.6% through 2020. By 2020 the overall market is estimated to generate revenue of $42.6 billion.

E N D
To Enquire About the Report Click Here IndustryARC GLOBAL VALVES, ACTUATORS AND POSITIONERS MARKET (2015 – 2020) By Application (Aerospace, Automotive, Electronics & Others); By Valve type (Multi turn, quarter turn & others); By Actuator type (Hydraulic, Pneumatic, Electric & others); By Positioner type (Pneumatic and Electro pneumatic)
To Enquire About the Report Click Here Table of Contents 1.Global Valves, Actuators and Positioners market overview 2.Executive summary 3.Global Valves, Actuators and Positioners market landscape 3.1.Market share analysis 3.2.Comparative analysis 3.2.1. Product Benchmarking 3.2.2. End-User Profiling 3.2.3. Patent analysis 3.2.4. Top5 Financial analysis 4.Global Valves, Actuators and Positioners- Market Forces 4.1.Market Drivers 4.2.Market Constraints 4.3.Market Challenges 4.4.Attractiveness of the Actuators and Positioners Industry 4.4.1. Power of suppliers 4.4.2. Power of Customers 4.4.3. Threat of New entrants 4.4.4. Threat of substitution 4.4.5. Degree of Competition 5.Global Valves, Actuators and Positioners Market- Strategic Analysis 5.1.Value Chain Analysis 5.2.Pricing Analysis 5.3.Opportunities Analysis
To Enquire About the Report Click Here 5.4.Product/Market Life Cycle Analysis 5.5.Suppliers and Distributors 6.Global Valves, Actuators and Positioners Market- by Valve types 6.1. Multi-turn valves 6.2.Quarter-turn valves 6.3.Control valves 6.4.Others 7.Global Valves, Actuators and positioners Market- by Actuators types 7.1.Electric Actuator 7.2.Pneumatic Actuator 7.3.Hydraulic Actuator 7.4.Manual Actuator 7.5.Others 8.Global Valves, Actuators and positioners Market- by Positioner types 8.1.Pneumatic Positioner 8.2.Electro-pneumatic positioner 8.3.Others 9.Global Valves, Actuators and Positioners- by Application 9.1.Aerospace 9.2.Agriculture 9.3.Automotive 9.4.Defense and Marine 9.5.Mining 9.6.Oil & Gas
To Enquire About the Report Click Here 9.7.Mining 9.8.Water purifying 9.9.Others 10.Global Valves, Actuators and Positioners -Geographic Analysis 10.1. North Americas 10.1.1.U.S. 10.1.2.Canada 10.1.3.Argentina 10.1.4.Brazil 10.2. Europe 10.2.1.U.K. 10.2.2.France 10.2.3.Germany 10.2.4.Italy 10.3. APAC 10.3.1.China 10.3.2.South Korea 10.3.3.Japan 10.3.4.Australia 10.4. ROW 10.4.1.South Africa 10.4.2.Middle-east 11.Market Entropy 11.1. New Product Launches
To Enquire About the Report Click Here 11.2. M&As, Collaborations, JVs and Partnerships 12.Company Profiles(Overview, Financials, SWOT Analysis, Developments, Product Portfolio) 12.1. Rotork Controls, Inc. 12.2. AUMA Actuators, Inc. 12.3. GE Oil & Gas 12.4. Apollo Valves - Conbraco Industries, Inc. 12.5. Emerson Electric Co. 12.6. Pentair Valves & Controls 12.7. Flowserve Corporation HQ 12.8. Curtiss-Wright Valve Group - Industrial Division 12.9. Cameron International Corp 12.10.Emerson Electric Co. 12.11.Unitorq Actuators & Controls 12.12.Honeywell International Inc. 12.13.Gunric Valve Pty Ltd. 12.14.Crane Co. 12.15.Kingston Valves 12.16.Elliott Manufacturing 12.17.Alfa Laval AB 12.18.ABB Ltd. 12.19.ATI 12.20.Beaver Aerospace & Defense, Inc. 13.Appendix 13.1. Abbreviations
To Enquire About the Report Click Here 13.2. Sources 13.3. Research Methodology 13.4. Bibliography 13.5. Compilation of Expert Insights 13.6. Disclaimer
To Enquire About the Report Click Here LIST OF TABLES Table 1Global Valve Actuator and Positioner Market – Pricing Analysis ($) Table 2Global Valve Actuator Market Revenue, By Valve Type, 2014-2020 ($M) Table 3Global Valve Actuator Market Volume, By Valve Type, 2014-2020 (Units) Table 4Global Valve Positioner Market Revenue, By Actuator Type, 2014-2020 ($M) Table 5Global Valve Positioner Market Volume, By Actuator Type, 2014-2020 (Units) Table 6Global Valve Positioner Market Revenue, By Positioner Type, 2014-2020 ($M) Table 7Global Valve Positioner Market Volume, By Positioner Type, 2014-2020 (Units) Table 8Global Valve Actuator and Positioner Market Revenue, By Application, 2014-2020 ($M) Table 9Global Valve Actuator and Positioner Market Volume, By Application, 2014-2020 (Units) Table 10Global Valve Actuator and Positioner Market Revenue, By Geography, 2014-2020 ($M) Table 11Global Valve Actuator and Positioner Market Volume, By Geography, 2014-2020 (Units) Table 12Global Multi-turn valve Market Revenue, By Application, 2014-2020 ($M) Table 13Global Multi-turn valve Market Volume, By Application, 2014-2020 (Units) Table 14Global Quarter-turn valve Market Revenue, By Application, 2014-2020($M) Table 15Global Quarter-turn valve Market Volume, By Application, 2014-2020 (Units) Table 16Global Self-Actuated valve Market Revenue, By Application, 2014-2020 ($M) Table 17Global Self- Actuated valve Market Volume, By Application, 2014-2020 (Units) Table 18Global Other valve Market Revenue, By Application, 2014-2020 ($M) Table 19Global Other valve Market Revenue, By Application, 2014-2020 (Units) Table 20Global Hydraulic Actuator Market Revenue, By Application, 2014-2020 ($M) Table 21Global Hydraulic Actuator Market Volume, By Application, 2014-2020 (Units) Table 22Global Pneumatic Actuator Market Revenue, By Application, 2014-2020 ($M) Table 23Global Pneumatic Actuator Market Volume, By Application, 2014-2020 (Units) Table 24Global Electric Actuator Market Revenue, By Application, 2014-2020 ($M) Table 25Global Electric Actuator Market Volume, By Application, 2014-2020 (Units) Table 26Global Mechanical Actuator Market Revenue, By Application, 2014-2020 ($M) Table 27Global Mechanical Actuator Market Volume, By Application, 2014-2020 (Units) Table 28Global Other Actuator Market Revenue, By Application, 2014-2020 ($M) Table 29Global Other Actuator Market Volume, By Application, 2014-2020 (Units) Table 30Global Pneumatic Positioner Market Revenue, By Application, 2014-2020 ($M) Table 31Global Pneumatic Positioner Market Volume, By Application, 2014-2020 (Units)
To Enquire About the Report Click Here Table 32Global Electro Pneumatic Positioner Market Volume, By Application, 2014-2020 (Units) Table 33Global Electro Pneumatic Positioner Market Revenue, By Application, 2014-2020 ($M) Table 34Global Other Positioner Market Revenue, By Application, 2014-2020 ($M) Table 35Global Other Positioner Market Volume, By Application, 2014-2020 (Units) Table 36Americas Valve Actuators & Positioners Market Revenue, By Type, 2014-2020 ($M) Table 37Americas Valve Actuators & Positioners Market Volume, By Type, 2014-2020 (Units) Table 38Americas Valve Actuators & Positioners Market Revenue, By Application, 2014-2020 ($M) Table 39Americas Valve Actuators & Positioners Market Volume, By Application, 2014-2020 (Units) Table 40Americas Valve Actuators & Positioners Market Revenue, By Country, 2014-2020 ($M) Table 41Americas Valve Actuators & Positioners Market Volume, By Country, 2014-2020 (Units) Table 42APAC Valve Actuators & Positioners Market Revenue, By Type, 2014-2020 ($M) Table 43APAC Valve Actuators & Positioners Market Volume, By Type, 2014-2020 (Units) Table 44APAC Valve Actuators & Positioners Market Revenue, By Application, 2014-2020 ($M) Table 45APAC Valve Actuators & Positioners Market Volume, By Application, 2014-2020 (Units) Table 46APAC Valve Actuators & Positioners Market Revenue, By Country, 2014-2020 ($M) Table 47APAC Valve Actuators & Positioners Market Volume, By Country, 2014-2020 (Units) Table 48Europe Valve Actuators & Positioners Market Revenue, By Type, 2014-2020 ($M) Table 49Europe Valve Actuators & Positioners Market Volume, By Type, 2014-2020 (Units) Table 50Europe Valve Actuators & Positioners Market Revenue, By Application, 2014-2020 ($M) Table 51Europe Valve Actuators & Positioners Market Volume, By Application, 2014-2020 (Units) Table 52Europe Valve Actuators & Positioners Market Revenue, By Country, 2014-2020 ($M) Table 53Europe Valve Actuators & Positioners Market Volume, By Country, 2014-2020 (Units) Table 54RoW Valve Actuators & Positioners Market Revenue, By Type, 2014-2020 ($M) Table 55RoW Valve Actuators & Positioners Market Volume, By Type, 2014-2020 (Units) Table 56RoW Valve Actuators & Positioners Market Revenue, By Application, 2014-2020 ($M) Table 57RoW Valve Actuators & Positioners Market Volume, By Application, 2014-2020 (Units) Table 58RoW Valve Actuators & Positioners Market Revenue, By Country, 2014-2020 ($M) Table 59RoW Valve Actuators & Positioners Market Volume, By Country, 2014-2020 (Units) Table 60Global Multi-turn Valve Market Revenue, By Geography, 2014-2020($M)
To Enquire About the Report Click Here Table 61Global Multi-turn Valve Market Volume, By Geography, 2014-2020 (Units) Table 62Global Quarter-turn Valve Market Revenue, By Geography, 2014-2020 ($M) Table 63Global Quarter-turn Valve Market Volume, By Geography, 2014-2020 (Units) Table 64Global Self-actuated Valve Market Revenue, By Geography, 2014-2020 ($M) Table 65Global Self-actuated Valve Market Volume, By Geography, 2014-2020 (Units) Table 66Global Other Valve Market Revenue, By Geography, 2014-2020 ($M) Table 67Global Other Valve Market Volume, By Geography, 2014-2020 (Units) Table 68Global Hydraulic Actuator Market Revenue, By Geography, 2014-2020 ($M) Table 69Global Hydraulic Actuator Market Volume, By Geography, 2014-2020 (Units) Table 70Global Pneumatic Actuator Market Revenue, By Geography, 2014-2020 ($M) Table 71Global Pneumatic Actuator Market Volume, By Geography, 2014-2020 (Units) Table 72Global Electric Actuator Market Revenue, By Geography, 2014-2020 ($M) Table 73Global Electric Actuator Market Volume, By Geography, 2014-2020 (Units) Table 74Global Mechanical Actuator Market Revenue, By Geography, 2014-2020 ($M) Table 75Global Mechanical Actuator Market Volume, By Geography, 2014-2020 (Units) Table 76Global Other Actuator Market Revenue, By Geography, 2014-2020 ($M) Table 77Global Other Actuator Market Volume, By Geography, 2014-2020 (Units) Table 78Global Pneumatic Positioner Market Revenue, By Geography, 2014-2020 ($M) Table 79Global Pneumatic Positioner Market Volume, By Geography, 2014-2020 (Units) Table 80Global Electro-Pneumatic Positioner Market Revenue, By Geography, 2014-2020 ($M) Table 81Global Electro-Pneumatic Positioner Market Volume, By Geography, 2014-2020 (Units) Table 82Global Other Positioner Market Revenue, By Geography, 2014-2020 ($M) Table 83Global Other Positioner Market Volume, By Geography, 2014-2020 (Units) Table 84M&A, Product Launches, 2010-2015
To Enquire About the Report Click Here LIST OF FIGURES Figure1Global Valve Actuator and Positioner Market, By Geography, 2014 - 2020 ($M) Figure2Segmentation of Global Valve Actuator and Positioner Market Figure3Global Valve Actuator and Positioner Market Competitive Share Analysis, 2014(%) Figure4Global Valve Actuator and Positioner Market Share, By Type of valve, 2014 (%) Figure5Global Valve Actuator and Positioner Market Share, By Type of actuator, 2014 (%) Figure6Global Valve Actuator and Positioner Market Share, By Type of positioner, 2014 (%) Figure7Global Valve Actuator and Positioner Market Share, By Application, 2014 (%) Figure8Global Valve Actuator and Positioner Market Share, By Geography, 2014 (%) Figure9Americas Valve Actuator and Positioner Market Share, By Country, 2014 (%) Figure10Europe Valve Actuator and Positioner Market Share, By Country, 2014 (%) Figure11APAC Valve Actuator and Positioner Market Share, By Country, 2014 (%) Figure12RoW Valve Actuator and Positioner Market Share, By Country, 2014 (%) Figure13Global Valve Actuator and Positioner Market Recent Developments, By Year, 2012-2015
To Enquire About the Report Click Here 1.GLOBAL VALVES, ACTUATORS AND POSITIONERS MARKET OVERVIEW 1.1 REPORT SCOPE A Valve is a device which is used to control or regulate the flow of liquid and gases. Based on the type of movement Valves can be classified as Multi-turn valves, Quarter-turn valves, Self-actuated valves and others. The movement of Multi- turn valve is generally linear causing linear displacement of the valve. Quarter turn cause rotary motion which is capable of rotating from 0 degree to 90 degree. Self-actuated valve is a valve which can be operated remotely without human intervention. An actuator is fitted into the valve which controls the movement of the valve based on predefined conditions. Actuator is a device which is responsible for performing certain actions such as to control or to move a system. Generally to operate an actuator a source of energy is necessary where in the source of energy can be in the form of hydraulic, pneumatic, electric or mechanical. Hydraulic actuator consists of fluid motor which uses hydraulic power to facilitate mechanical action. Pneumatic actuators convert energy formed by vacuum or high pressure air to linear or rotatory motion. Electric actuator is an electric motor which converts electric energy into mechanical energy. Mechanical actuators also called as Manual actuators are used to convert mechanical energy to linear or rotary motion. Positioner is a component which controls the activities of an actuator. Based on the type of energy source provided to a positioner, an positioner can be classified into either pneumatic or electro- pneumatic positioner. The regional segmentation of Global Valves, Actuator and Positioner market is by identifying the countries that are leading in the utilization of Valves and actuators. The major countries include the U.S. and Canada in North America; U.K., France and Germany in Europe; India, China, Japan, Australia and South Korea in Asia-Pacific region. Some of the key players in Valves Actuator and Positioner industry are: Rotork Controls Inc, Honeywell Inc, Ati, Moog Inc, Saab Group, Emerson Electric Co, Unitorque, Crane co., Cameron, Curtiss Wright Corp, Pentair Ltd, Rockwell Collins Inc and Woodword, Inc. 1.2 STAKEHOLDERS •Actuators system manufacturer •Valve manufacturers •Positioner manufacturers •Actuators and positioner components suppliers •Component and Sub-component manufacturers •Test Rig Manufacturers •Distributors •Associations
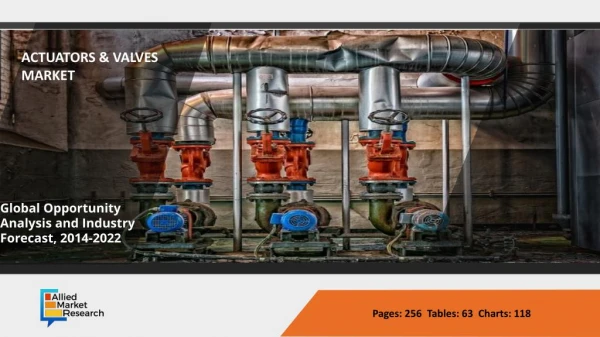
To Enquire About the Report Click Here 2.EXECUTIVE SUMMARY Over the past few years many Industries have seen a dramatic change in the use of sophisticated technologies. One of the common devices used by almost all the industries is a Valve. A Valve is a device which is used to regulate the flow of liquid or gases by performing actions such as opening or closing of the port. It acts as a gateway to any system which requires regulated and directed flow activities. A valve is generally made up of 3 main components which include an actuator, a positioner and a valve body. An actuator is a component which is responsible for inducing mechanical movements to a device by converting energy from a source into mechanical movements. Whereas a positioner is a component generally fitted into a control valve which helps in controlling the activities of an actuator, generally opening and closing of actuator, based on predefined conditions. When it comes to uses of Valves, actuators and Positioners in the Global market, North America and Europe by far have the largest base for the valves and actuators market mainly because of developed economy and having related expertise. About 35% of global demand is satisfied by American valve and actuator market. On the other hand, in the Asia-Pacific region the growth of Valves and actuators market is the highest and will continue to grow due to industrialization and technological advancement. According to U.S Department of Commerce, in the year 2014, the import of hydraulic actuators from the major trade partners was recorded to be about $ 7.2 billion where in the major trade partners were Germany, Japan, Mexico, Canada, China and many others. While the export of hydraulic actuators to major trade partners was recorded to be about $5.5 billion where in the major trade partners for export were Canada, Mexico, China, Brazil, Germany and many others.
To Enquire About the Report Click Here U.S. HYDRAULIC ACTUATORS EXPORT MARKET SHARE, BY TRADING COUNTRIES, 2013 (%) SOURCE: National Fluid Power Association (NFPA), IndustryARC Analysis One of the leading consumers of actuator and positioner market is the Aerospace industry. In the year 2013 the aerospace industry saw a remarkable growth which in turn resulted in increase in demand for actuators and positioners in the U.S., European and Asian markets. The operating profits and the revenue of aerospace industry was the highest in the history. Top Aerospace companies like Airbus, Boeing, Bombardier and many others set a record by earning highest operating profit and revenue.
To Enquire About the Report Click Here SAMPLE TABLE: GLOBAL VALVES, ACTUATORS & POSITIONERS MARKET REVENUE, BY ACTUATOR PRODUCT TYPE, 2014-2020 ($M) Product Type 2014 2015 2016 2017 2018 2019 2020 CAGR (2015- 2020)% xx% Hydraulic xx xx xx xx xx xx xx Pneumatic xx xx xx xx xx xx xx xx% Electric xx xx xx xx xx xx xx xx% Mechanical xx xx xx xx xx xx xx xx% Others xx xx xx xx xx xx xx xx% Source: IndustryARC Analysis, Expert Insights Since the number of civil passengers are increasing, the civil aerospace market is forecast to grow remarkably in the coming years and is expected to double between 2015- 2030. The driving force for this growth is not only because of the need to replace the aging aircrafts with more efficient and environmental friendly one’s, but also because there is global increase in the air traffic, which is suspected to grow at the rate of 4.7% between 2015-2030. Thus, the increasing demand for new aircrafts in civil aerospace market will remain a key driver for the actuators and positioners market in the coming years. When it comes to valve market, the major consumer for valve market is the Oil & Gas industry. The sales in Middle east for valves is the highest as there are a number of Oil extracting industries where in valve is an important component for Oil extraction. As countries like U.S. and Canada are investing in Oil Shale and Tar Oil exploration, the demand for valve, which is the key driver for such explorations, will increase substantially.
To Enquire About the Report Click Here KEY MARKET INSIGHTS Valves, actuators and positioners are widely being used in oil and gas, aerospace industry followed by automotive and mining industry. Rapid industrialization in developing countries like India and China is the major driving force for valves, actuators and positioner market Automated valves are widely being used as a solution to problem of safety and security in an operational plant In Robotics, Piezoelectric actuators are widely being used which takes electric signals as inputs and converts it into mechanical motion. Positioners are now being equipped with sensors to detect failures and faults precisely which up till now were being identified indirectly.
To Enquire About the Report Click Here RESEARCH METHODOLOGY The quantitative and qualitative data collected for the valves actuators and positioner market report is from a combination of secondary and primary sources. Research interviews were conducted with senior executives and/or managers of leading actuator and positioner solution providers. These Key Opinion Leaders (KOLs) were then provided a questionnaire to gather quantitative and qualitative inputs on their operations, performance, strategies and views on the overall market, including key developments and technology trends. Data from interviews is consolidated, checked for consistency and accuracy, and the final market numbers are again validated by experts. The global market was split by types, application and geography based on different factors like primary and secondary sources, understanding of the number of companies operating in each segment and also KOL insights. We have used various secondary sources such as directories, articles, white papers, newsletters, annual reports and paid databases such as OneSource, Hoovers and Factiva to identify and collect information for extensive technical and commercial study of the actuator and positioner market. The key players in the market and its value chain were identified through secondary research and their market opinions were also gathered in a similar way through telephonic interviews and questionnaires. We have also studied the annual reports of these top market players. Interviews with key opinion leaders such as directors, managers, and marketing personnel were used extensively in understanding the need and emergence of the actuator and positioner market.
To Enquire About the Report Click Here THE ARC ADVANTAGE An analytical model lies at the core of our process, ensuring logical consistency throughout our research. We complement the model with secondary data and interviews with industry experts to reflect the latest trends. With our final expert validation, we provide you with only the most accurate and actionable intelligence. THE ARC PROCESS Base Method Analytical Method Consolidation Method Delphi Verification 1. Granular breakdown of drivers into factors 2. Validate all factors in terms of their present impact on the market 3. Assign weights to these factors in terms of their relevance and impact on the market 4. Build the Analytical Model 1. Get a top- down estimate of the market 2. Follow it up with a bottom-up estimate of the market 3. Check forconsistency and new growth factors that are relevant over the next 10 Years 4. Build the Base model 1. Granular breakdown of drivers into factors 2. Validate all factors in terms of their present impact on the market. 3. Assign weights to these factors in terms of their relevance and impact on the market. 4. Build the Consolidated Model 1. Verify the findings of the model with experts from across the value chain 2. Verify the findings with players across small and large enterprises 3. Tweak the model and add new factors 4. Finalize the ARC Model ANALYTICAL MODEL BASE MODEL CONSOLIDATED MODEL ARC MODEL
To Enquire About the Report Click Here ABOUT US IndustryARC was started by a group of young, passionate professionals along with extensively experienced industry veterans across various business segments. Our focus and expertise is mainly in the field of analytics, market research and consulting. Our singular goal is to provide accurate and affordable research to our clients. Our research team has expertise in diverse fields like Automotive, Chemicals,Consumer Product & Services, Electronics, Food & Beverages, Healthcare etc., However diverse the expertise maybe, everyone in our team shares one common trait - we love data and we love providing solutions to clients using that data even more! Seeing your business flourish based on our solutions and strategy is what we love the most! IndustryARC publishes more than 30 reports on an annual basis in the mentioned Industries. Our reports are in-depth and high quality reports that can help decision makers frame better strategies for their business requirements. These reports can be further customized as per your needs. Disclaimer: •The reports sold by IndustryARC are limited publications containing valuable market information provided to a select group of customers in response to orders. •Our customers acknowledge and agree that any report bought from IndustryARC is for their own internal use and not for general publication or disclosure to third parties. •Our reports or part of the reports, information contained in the report, cannot be shared or resold to any other third party. •Disclosure to third parties, usage of data in a public document, article or blog by the customer can be done with prior permission taken from IndustryARC. For information regarding permissions and sales, contact: sales@industryarc.com | sanjay.matthews@industryarc.com
To Enquire About the Report Click Here IndustryARC +1 614 - 588 - 8538 sales@industryarc.com Copyright ©2015 IndustryARC All Rights Reserved. This document contains highly confidential information and is the sole property of IndustryARC. No part of it may be circulated, copied, quoted, or otherwise reproduced without the approval of IndustryARC.