Download
1 / 20
200 likes | 560 Views
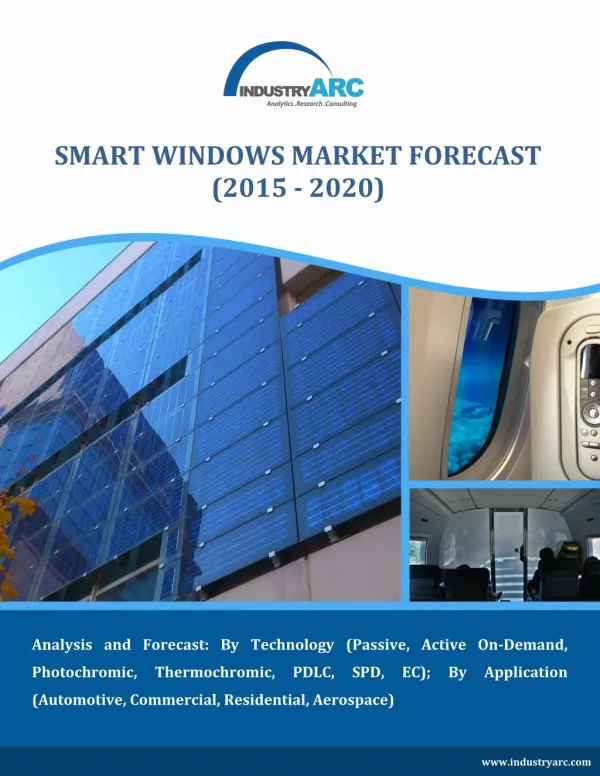
The Report “Smart Windows Market – Analysis and Forecast: By Technology (Passive, Active On-Demand, Photochromic, Thermochromic, PDLC, SPD, EC); By Application (Automotive, Commercial, Residential, Aerospace) - With Forecast (2015 - 2020)”, published by IndustryARC, the market to reach $9.1 billion by 2020<br>Request a Sample @ http://industryarc.com/pdfdownload.aspx?id=1258<br>

E N D
SMART WINDOWS MARKET FORECAST (2015 - 2020) Analysis and Forecast: By Technology (Passive, Active On-Demand, Photochromic, Thermochromic, PDLC, SPD, EC); By Application (Automotive, Commercial, Residential, Aerospace) www.industryarc.com
To Enquire About the Report Click Here TABLE OF CONTENTS 1Smart Windows Market Overview 1.1Global Smart Windows Market Overview 1.2Classification 1.3Stake Holders 2Executive Summary 3Market Landscape 3.1Market Share Analysis 3.2Comparative Analysis 3.2.1Product Benchmarking 3.2.2End User Profiling 3.2.3Patent Analysis 3.2.4Top 5 Financials Analysis 4Smart Windows Market Forces 4.1Market Drivers 4.1.1Conservation of Energy Through “Smart” Windows Turning Into Dark Mode 4.1.2Increase in Cost of Energy In Asian Countries Creating A Huge Market For The Smart Windows 4.1.3Up-Surging Growth in The Automobile Market is Through Photovoltaics Integrated Smart Glass. 4.2Market Constraints 4.2.1Regulations Make The Limited Use of Smart Windows in The Automobile Industry Limited 4.2.2Shortage of Skilled Professionals Cause Use of Cost Associated Robots In The Glass Industry 4.3Market Challenges 4.3.1Usage of Ito Films Can Be Avoided Due To The High Cost and The Environmental Issues
To Enquire About the Report Click Here 4.4Market Attractiveness 4.4.1Power of Suppliers 4.4.2Power of Buyers 4.4.3Threat of New Entrants 4.4.4Threat of Substitute 4.4.5Competitive Rivalry 5Smart Windows Market – Strategic Analysis 5.1Value Chain Analysis 5.1.1Research and Developments 5.1.2Raw Material Supplier 5.1.3Original Equipment Manufacturers 5.1.4Distributors 5.1.5End-User Applications 5.2Pricing Analysis 5.3Opportunities Analysis 5.3.1Innovation In Materials And Specialty Chemicals Enable Upsurge In Smart Windows Market 5.3.2Smart Glass Turns Into An Intelligent Product Through The Evolution of Internet-of-Things 5.4Product/Market Life Cycle Analysis 5.5Suppliers and Distributors 6Smart Windows Market – by Technology 6.1Passive 6.1.1Passive Retrofit 6.1.2Passive Thermochromic 6.1.3Passive Photochromic 6.2Active-On-Demand 6.2.1Polymer Dispersed Liquid Crystals (PDLC) 6.2.2Suspended Particle Device (SPD)
To Enquire About the Report Click Here 6.2.3ELECTROCHROMIC (EC) 6.3Self-Cleaning Windows 7Smart Windows Market-By Application Segments 7.1Commercial Buildings 7.2Residential Buildings 7.3Automotive 7.3.1Trucks 7.3.2Buses 7.3.3Cars 7.3.4Trains 7.4Aerospace 7.5Marine 7.6Others 8Smart Windows Market By Geography 8.1North America 8.1.1U.S. 8.1.2Canada 8.2Europe 8.2.1Germany 8.2.2France 8.2.3U.K. 8.2.4Others 8.3Asia Pacific 8.3.1Korea 8.3.2China 8.3.3Japan 8.3.4Others 8.4Rest Of The World 8.4.1Middle East And Africa
To Enquire About the Report Click Here 9Thin Films Market -by Material Type 9.1Indium Tin Oxide (Ito) 9.2Ito Inks and Pastes 9.3Transparent Organic Conductors (Toc) 9.4Carbon Nanotube Based Formulations 9.5Nanomaterials 9.6Composites and Metals 10Transparent Conductors – by Material Type 10.1ITO 10.2SNO2 10.3ZNO 10.4Tio2 10.5Ag-Based TCS 10.6CNT Based TCS 10.7PEDOT:PSS 10.8AZO 10.9GZO 10.10IZO 11Smart Windows Market – Market Entropy 11.1New Product Launches 11.2Mergers And Acquisitions, Joint Ventures & Partnerships And Collaborations 11.2.1Mergers And Acquisitions 11.2.2Joint Ventures 11.2.3Collaborations 12Company Profiles 12.1Asahi Glass Co. 12.1.1Business Overview 12.1.2Financials 12.1.3Products
To Enquire About the Report Click Here 12.1.4Strategy 12.1.5Developments 12.2Chromogenics AB Company 12.2.1Business Overview 12.2.2Financials 12.2.3Products 12.2.4Developments 12.3Beijing All Brilliant Technologies Co., Ltd. 12.3.1Business Overview 12.3.2Financials 12.3.3Products 12.3.4Developments 12.4Chiefway Optronics Company 12.4.1Business Overview 12.4.2Financials 12.4.3Products 12.4.4Developments 12.5Common Wealth Glass and Mirror Corp. 12.5.1Business Overview 12.5.2Financials 12.5.3Products 12.5.4Developments 12.6Corning Inc. 12.6.1Business Overview 12.6.2Financials 12.6.3Products 12.6.4Strategy 12.6.5Developments 12.7DUPONT
To Enquire About the Report Click Here 12.7.1Business Overview 12.7.2Financials 12.7.3Products 12.7.4Developments 12.8GARWARE Sun Control 12.8.1Business Overview 12.8.2Financials 12.8.3Products 12.8.4Developments 12.9GENTEX Corporation 12.9.1Business Overview 12.9.2Financials 12.9.3Products And Services 12.9.4Strategy 12.9.5Developments 12.10Guardian Industries Corporation 12.10.1Business Overview 12.10.2Financials 12.10.3Products And Services 12.10.4Developments 12.11Johnson Laminating & Coat Inc. 12.11.1Business Overview 12.11.2Financials 12.11.3Products and Services 12.11.4Developments 12.12Polytron Technologies, Inc. 12.12.1Business Overview 12.12.2Financials 12.12.3Products And Services
To Enquire About the Report Click Here 12.12.4Developments 12.13Sage Electrochromics, Inc. 12.13.1Business Overview 12.13.2Financials 12.13.3Products And Services 12.13.4Developments 12.14Saint-Gobain S.A. 12.14.1Business Overview 12.14.2Financials 12.14.3Products And Services 12.14.4Strategy 12.14.5Developments 12.15Schott Ag 12.15.1Business Overview 12.15.2Financials 12.15.3Products 12.15.4Strategy 12.15.5Developments 12.16Sekisui Chemical Co., Ltd. 12.16.1Business Overview 12.16.2Financials 12.16.3Products 12.16.4Developments 12.17View Inc. 12.17.1Business Overview 12.17.2Financials 12.17.3Products 12.17.4Developments 12.18Toray Plastics (Americas) Inc.
To Enquire About the Report Click Here 12.18.1Business Overview 12.18.2Financials 12.18.3Products 12.18.4Developments 12.19Switch Materials Inc. 12.19.1Business Overview 12.19.2Financials 12.19.3Products 12.19.4Developments 12.20Us E-Chromics Technologies, Inc. 12.20.1Business Overview 12.20.2Financials 12.20.3Products 12.20.4Developments 12.21Ravenbrick Llc 12.21.1Business Overview 12.21.2Financials 12.21.3Products 12.21.4Developments 12.22Heliotrope Technologies 12.22.1Business Overview 12.22.2Financials 12.22.3Developments 12.23Vision Ventures International FZC 12.23.1Business Overview 12.23.2Financials 12.23.3Products And Services 12.23.4Developments 12.24Glass Apps, LLC
To Enquire About the Report Click Here 12.24.1Business Overview 12.24.2Financials 12.24.3Products 12.25Developments 12.25.1Smart Glass Industries Ltd. 12.25.2Business Overview 12.25.3Financials 12.25.4Products 12.25.5Developments 13Appendix 13.1Abbreviations 13.2Sources 13.3Research Methodology 13.4Expert Insights 13.5Disclaimer
To Enquire About the Report Click Here LIST OF TABLES Table 1 Table 2 Table 3 Table 4 Global Smart Windows Market, Top Suppliers Rankings, 2014 Global Thin Film Manufacturers Top Suppliers Rankings, 2014 Smart Windows Market, Top 5 Financials Analysis, 2014 Global Passive Smart Windows Market Volume, by Technology, 2014-2020 (Thousand SQ.M) Table 5 Global Passive Smart Windows Market Revenue, by Technology, 2014-2020 ($ Million) Table 6 Global Passive Smart Windows Market Revenue, by Application, 2014-2020 ($ Million) Table 7 Global Active On-Demand Smart Windows Market Volume, by Technology, 2014- 2020 (Thousand SQ.M) Table 8 Global Active On-Demand Smart Windows Market Revenue, by Technology, 2014- 2020 ($ Million) Table 9 Global Active On-Demand Smart Windows Market Revenue, by Application, 2014- 2020 ($ Million) Table 10 Global Self-Cleaning Smart Windows Market Revenue, by Application, 2014-2020 ($ Million) Table 11 Global Smart Windows Market Volume, by Application, 2014-2020 (Thousand SQ.M) Table 12 Table 13 Global Smart Windows Market Revenue, by Application, 2014-2020 ($ Million) Global Smart Windows Market Volume, by Architectural Application, 2014-2020 (Thousand SQ.M) Table 14 Global Smart Windows Market Revenue, by Architectural Application, 2014-2020 ($ Million) Table 15 Global Smart Windows Market Volume, by Automotive Application, 2014-2020 (Thousand SQ.M) Table 16 Global Smart Windows Market Revenue, by Automotive Application, 2014-2020 ($ Million) Table 17 North America Smart Windows Market Revenue, by Technology, 2014-2020 ($ Million)
To Enquire About the Report Click Here Table 18 North America Passive Smart Windows Market Revenue, by Technology, 2014-2020 ($ Million) Table 19 North America Active On-Demand Smart Windows Market Revenue, by Technology, 2014-2020 ($ Million) Table 20 North America Smart Windows Market Revenue, by Application, 2014-2020 ($ Million) Table 21 North America Smart Windows Market Revenue, by Architectural Application, 2014- 2020 ($ Million) Table 22 North America Smart Windows Market Revenue, by Automotive Application, 2014- 2020 ($ Million) Table 23 North America Smart Windows Market Revenue, by Country, 2014-2020 ($ Million) Table 24 Table 25 Europe Smart Windows Market Revenue, by Technology, 2014-2020 ($ Million) Europe Passive Smart Windows Market Revenue, by Technology, 2014-2020 ($ Million) Table 26 Europe Active On-Demand Smart Windows Market Revenue, by Technology, 2014- 2020 ($ Million) Table 27 Table 28 Europe Smart Windows Market Revenue, by Application, 2014-2020 ($ Million) Europe Smart Windows Market Revenue, by Architectural Application, 2014-2020 ($ Million) Table 29 Europe Smart Windows Market Revenue, by Automotive Application, 2014-2020 ($ Million) Table 30 Table 31 Table 32 Europe Smart Windows Market Revenue, by Country, 2014-2020 ($ Million) APAC Smart Windows Market Revenue, by Technology, 2014-2020 ($ Million) APAC Passive Smart Windows Market Revenue, by Technology, 2014-2020 ($ Million) Table 33 APAC Active On-Demand Smart Windows Market Revenue, By Technology, 2014- 2020 ($ Million) Table 34 Table 35 APAC Smart Windows Market Revenue, by Application, 2014-2020 ($ Million) APAC Smart Windows Market Revenue, by Architectural Application, 2014-2020 ($ Million)
To Enquire About the Report Click Here Table 36 APAC Smart Windows Market Revenue, by Automotive Application, 2014-2020 ($ Million) Table 37 Table 38 APAC Smart Windows Market Revenue, by Country, 2014-2020 ($ Million) MEA and LA Smart Windows Market Revenue, by Technology, 2014-2020 ($ Million) Table 39 MEA and LA Passive Smart Windows Market Revenue, by Technology, 2014-2020 ($ Million) Table 40 MEA and LA Active On-Demand Smart Windows Market Revenue, by Technology, 2014-2020 ($ Million) Table 41 Mea and LA Smart Windows Market Revenue, by Application, 2014-2020 ($ Million) Table 42 MEA and LA Smart Windows Market Revenue, by Architectural Application, 2014- 2020 ($ Million) Table 43 MEA and LA Smart Windows Market Revenue, by Automotive Application, 2014- 2020 ($ Million) Table 44 Global Smart Windows Thin Films Market Revenue, by Material Type, 2014-2020 ($ Million) Table 45 Table 46 Global Smart Windows Market: Key Product Launches Global Smart Windows Market, Key Developments: Mergers & Acquisitions, Joint Ventures and Collaborations.
To Enquire About the Report Click Here LIST OF FIGURES Figure1 Figure2 Figure3 Figure4 Figure5 Figure6 Figure7 Global Smart Windows Market, by Segments Global Smart Windows Market, by Years, 2014-2020 ($ Million) Global Smart Windows Market, by Geography, 2014-2020 ($ M) Global Smart Windows Market, by End User Applications, 2014 (%) Smart Windows - Patent Analysis, 2011-2015 (Number Of Patents) Smart Windows - Patent Analysis, by Key Players, 2014 (%) Estimated Decline in Asps of Smart Windows Technologies, by Types, 2015-2020 (%) Figure8 Estimated Decline in Asps of Passive Smart Windows, by Types, 2015-2020 (%) Figure9 Figure10U.S. Smart Windows Market Revenue, 2014-2020 ($ Million) Figure11Canada Smart Windows Market Revenue, 2014-2020 ($ Million) Figure12Germany Smart Windows Market Revenue, 2014-2020 ($ Million) Figure13France Smart Windows Market Revenue, 2014-2020 ($ Million) Figure14UK Smart Windows Market Revenue, 2014-2020 ($ Million) Figure15Other Regions Smart Windows Market Revenue, 2014-2020 ($ Million) Figure16South Korea Smart Windows Market Revenue, 2014-2020 ($ Million) Figure17China Smart Windows Market Revenue, 2014-2020 ($ Million) Figure18Japan Smart Windows Market Revenue, 2014-2020 ($ Million) Figure19Others APAC Smart Windows Market Revenue, 2014-2020 ($ Million) Figure20Global Smart Windows Transparent Conductors Market Revenue, by Material Type, Estimated Decline in Asps of Active Smart Windows, by Types, 2015-2020 (%) 2014-2020 ($ Million) Figure21Global Smart Windows Market, By Type of Development, 2011-2015*(%) Figure22Global Smart Windows Market – Product Launches, M&A's, Collaborations, JV'S & Partnerships, by Number of Developments, 2011 – 2015* Figure23Global Smart Windows Market Product Launches, by Years 2011-2015* Figure24Global Smart Windows Market Product Launches, by Key Players, 2011- 2015*(%)
To Enquire About the Report Click Here Figure25Global Smart Windows Market Year On Year Developments, by M&A’s,JV’S & Partnerships and Collaborations, 2011-2015* Figure26Global Smart Windows Market Developments, By M&A’s,JV’S & Partnerships and Collaborations, 2011-2015* (%) Figure27Global Smart Windows Market Developments, By M&A’s,JV’S & Partnerships and Collaborations, 2011-2015* (%) Figure28AGC Company Total Revenue, 2012-2014 ($ Billion) Figure29AGC Company Total Revenue, By Business Segments, 2014 (%) Figure30Corning Inc. Revenue, 2011-2014 (In $ Million) Figure31Corning Inc. Total Revenue, By Business Segments, 2014 (%) Figure32DUPONT Revenues, 2011-2014 ($ Billion) Figure33DUPONT Total Revenue, by Business Segments, 2014 (%) Figure34GARWARE Company Total Revenue, 2011-2014 (In $ Million) Figure35GENTEX Year On Year Revenues 2011-2014 ($ Billion) Figure36GENTEX Total Revenue, by Regions, 2014 (%) Figure37Saint-Gobain Year On Year Revenues 2011-2014 ($ Billion) Figure38Saint-Gobain Total Revenue, by Business Segments, 2014 (%) Figure39Schott AG: Total Sales, Year-On-Year, ($ Million) Figure40Schott AG: Total Sales, by Geography, 2013 (%) Figure41Sekisui Chemical Co. Ltd.: Total Sales, Year-On-Year, 2011-2014* ($ Million) Figure42Sekisui Chemical Co. Ltd.: Total Sales, by Geography*, 2013-14 (%) Figure43Toray Plastics (Americas) Inc.: Total Sales, Year-On-Year, 2011-2014* ($ Million) Figure44Toray Plastics (Americas) Inc.: Total Sales, by Segment, 2013 (%)
To Enquire About the Report Click Here KEY INSIGHTS The smart windows market has been analyzed by technology types like SPD, thermochromic, photochromic, self-cleaning windows and PDLC. It has also been segmented by passive and active- on-demand product types. Thin films market and transparent conductor oxides were also covered in the report to give an additional analysis into the value chain of the smart windows market. The smart windows market is expected to increase to around $9.1 billion by 2020. Thermochromic windows are the fastest growing product segment with a CAGR of 34.6% during 2015-2020. Design advantages, energy cost savings, increased production from OEMs and adoption of dynamic glazing are they key growth drivers of the market. Need for increased market knowledge on product advantages to the customers and higher cost of smart glass compared to normal glass are the major hurdles for the market. Middle East and Latin America regions are the growing markets and are expected to grow at a CAGR of 21.3%.
To Enquire About the Report Click Here RESEARCH METHODOLOGY The quantitative and qualitative data collected for the global Smart windows market report is from a combination of secondary and primary sources. Research interviews were conducted with executives and/or mangers in the key product manufacturers and related organizations. These Key Opinion Leaders (KOLs) were then provided a questionnaire to gather quantitative and qualitative inputs on their operations, performance, strategies and views on the overall market, including key developments and trends. Data from interviews is consolidated, checked for consistency and accuracy, and the final market numbers are again validated by experts. The global Smart windows market was split by grades of polycarbonate resins, applications and geography based on different factors like primary and secondary sources, understanding of the number of companies operating in each segment and also KOL insights. We have used various secondary sources such as directories, articles, white papers, newsletters, annual reports and paid databases such as OneSource, Hoovers and Factiva to identify and collect information for extensive commercial study of the global Smart windows market. The approach towards finding information regarding the market and forecasting has been quite extensive. The key players in the market and its value chain were identified through secondary research and their market opinions were also gathered in a similar way through telephonic interviews and questionnaires. Interviews with key opinion leaders such as managers and marketing personnel were used extensively in understanding the need and emergence of polycarbonate resin market. We also have extensive database of contacts which were used to conduct primary interviews and also to get their inputs using questionnaires.
To Enquire About the Report Click Here THE ARC ADVANTAGE An analytical model lies at the core of our process, ensuring logical consistency throughout our research. We complement the model with secondary data and interviews with industry experts to reflect the latest trends. With our final expert validation, we provide you with only the most accurate and actionable intelligence. THE ARC PROCESS Base Method Analytical Method Consolidation Method Delphi Verification 1. Granular breakdown of drivers into factors 2. Validate all factors in terms of their present impact on the market 3. Assign weights to these factors in terms of their relevance and impact on the market 4. Build the Analytical Model 1. Get a top- down estimate of the market 2. Follow it up with a bottom-up estimate of the market 3. Check forconsistency and new growth factors that are relevant over the next 10 Years 4. Build the Base model 1. Granular breakdown of drivers into factors 2. Validate all factors in terms of their present impact on the market. 3. Assign weights to these factors in terms of their relevance and impact on the market. 4. Build the Consolidated Model 1. Verify the findings of the model with experts from across the value chain 2. Verify the findings with players across small and large enterprises 3. Tweak the model and add new factors 4. Finalize the ARC Model ANALYTICAL MODEL BASE MODEL CONSOLIDATED MODEL ARC MODEL
To Enquire About the Report Click Here ABOUT US IndustryARC was started by a group of young, passionate professionals along with extensively experienced industry veterans across various business segments. Our focus and expertise is mainly in the field of analytics, market research and consulting. Our singular goal is to provide accurate and affordable research to our clients. Our research team has expertise in diverse fields like Automotive, Chemicals,Consumer Product & Services, Electronics, Food & Beverages, Healthcare etc., However diverse the expertise maybe, everyone in our team shares one common trait - we love data and we love providing solutions to clients using that data even more! Seeing your business flourish based on our solutions and strategy is what we love the most! IndustryARC publishes more than 30 reports on an annual basis in the mentioned Industries. Our reports are in-depth and high quality reports that can help decision makers frame better strategies for their business requirements. These reports can be further customized as per your needs. Disclaimer: The reports sold by IndustryARC are limited publications containing valuable market information provided to a select group of customers in response to orders. Our customers acknowledge and agree that any report bought from IndustryARC is for their own internal use and not for general publication or disclosure to third parties. Our reports or part of the reports, information contained in the report, cannot be shared or resold to any other third party. Disclosure to third parties, usage of data in a public document, article or blog by the customer can be done with prior permission taken from IndustryARC. For information regarding permissions and sales, contact: sales@industryarc.com | sanjay.matthews@industryarc.com
To Enquire About the Report Click Here IndustryARC +1 614 - 588 - 8538 sales@industryarc.com Copyright ©2015 IndustryARC All Rights Reserved. This document contains highly confidential information and is the sole property of IndustryARC. No part of it may be circulated, copied, quoted, or otherwise reproduced without the approval of IndustryARC.