Download
1 / 4
40 likes | 53 Views
Fundamental and Technical Analysis is like the best companions of every Investor and Trader. To succeed in the Stock Markets, start with a basic knowledge of Fundamental Analysis, know which sectors to look for and your Technical Analysis will take care of the rest.

E N D
How to use technical analysis to shortlist stocks to trade and invest "Wall Street is the only people that people ride to in a Rolls Royce to get advice from those who ride a subway" -Warren Buffett Those who desire to learn about the stock market will find it rewarding. It's not rocket science, but neither is it guessing. The winners in the stock market know what they're doing. They are guided by logic and analysis rather than sentiments in every decision they make. Fundamental and Technical Analysis is like the best companions of every Investor and Trader. "Which stock should I buy?" In the world of equities, this is a recurrent question. Given that the Indian stock market is divided into various sectors, each with a slew of competitors, addressing this issue may be difficult. This is where Technical Analysis enters. So, what is Technical Analysis? Stock technical analysis is the act of discovering and analyzing patterns to forecast market trends and where the market will go. The difference between
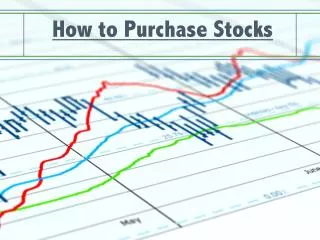
winners and losers in the stock market is determined by technical analysis. Sound Technical analysis of financial markets guarantees that traders are aware of when to enter and exit a market, as well as the price to target and the risk involved. The driving force behind Technical Analysis is the thought that all the relevant information regarding a stock is in its price. Hence, the price dictates the "trend" which the market will follow. The job of a trader is simply to ride that trend wave, whichever way it goes. If you are against those waves, they are sure to hit you badly. Hence, a Technical Analyst uses some indicators to filter out stocks from various sectors. If a stock shows a clear trend, it confirms that the stock might be shortlisted for further analysis. The trend, however, sets the difference between investing and trading. An investor looks for potential stocks which would continue reaching new highs over a long time(probably years). A trader, however, may obtain profits from both an uptrend or a downtrend. A trader sorts out the stocks with promising graphs after looking at the charts. This list can be whittled down from over 5000 equities traded to as little as ten stocks with which the trader intends to trade. Price and Volume are the most important factors that a Technical Analyst looks to analyze. These two factors set the precedent to derive more in-depth market data, as well as create indicator data. The best thing about trading in today's
world is that all these indicators are available in any standard software. Many Analysts also prefer using Candlestick patterns, Haiken Ashi, and Ichimoku to analyze trends and make trade calls! With some research and experience, even amateur traders can form their combination using these patterns, indicators. Let's talk indicators: Price is, without a doubt, the most crucial indicator to consider. Here's some advice for newcomers: Different periods can be used to examine price. It could be a one-minute, ten-minute, one-day, one-month, one-year, or even five-year graph. Traders look at shorter time intervals in general, while aggressive intraday traders look at even shorter time horizons. Investors, on the other hand, can assess the stock's quality by looking at a yearly or even 5-year graph. Moving Averages(MA) are the most commonly used indicators. Traders look at a certain price level of MA and if the price is above the MA level, it is an uptrend. For daily traders, these can range from 8 or 10-day Moving Averages. These can further be classified into Simple Moving Average(SMA), Exponential Moving Average (EMA), or Weighted Moving Average(WMA). Traders generally look for stocks where the Shorter Time frame Moving Average graph cuts the Longer time frame graph from below. For example, the 10-day EMA might cross the 21-day EMA.
Relative Strength Index is another indicator that is trusted for its ability to predict market momentum. RSI has a reading ranging from 0 to 100. Anything above 70 is considered an overbought zone, while anything below 40 is considered an oversold zone. Professional traders may also use other indicators like RS, Bollinger Bands, Supertrend, William %R. For momentum trading, traders often have their preset combinations and scans which they rely on for trades on the following day. Positional traders tend to zoom out a bit and rely on weekly charts or even monthly charts to filter out stocks. For retail traders who want to explore the market, and yet find the research part difficult, market scans along with some basic knowledge of Fundamental and Technical Analysis proves to be the golden combination. Elearnmarkets.com has simplified Fundamental Analysis, Technical Analysis for traders with their courses and webinars. Concluding, if you are a retail trader looking to carve out your path to success in the Stock Markets, start with a basic knowledge of Fundamental Analysis. Know which sectors to look for and your Technical Analysis will take care of the rest. Happy Trading!