Download
1 / 6
60 likes | 190 Views
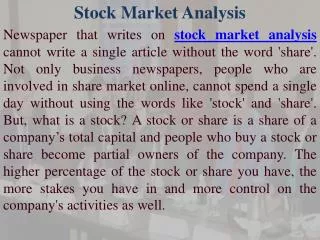
We all know that stock market analysis is integral to stock trading, irrespective of whether one is a novice or an expert. While at its simplest form, stock trading involves buying and selling of shares and securities, the main challenge lies in understanding what to buy and sell. <br>And this is where Data Science comes in.Data Science combines the knowledge of maths, statistics and computing to process this data and give us simple understandable outcomes.<br>

E N D
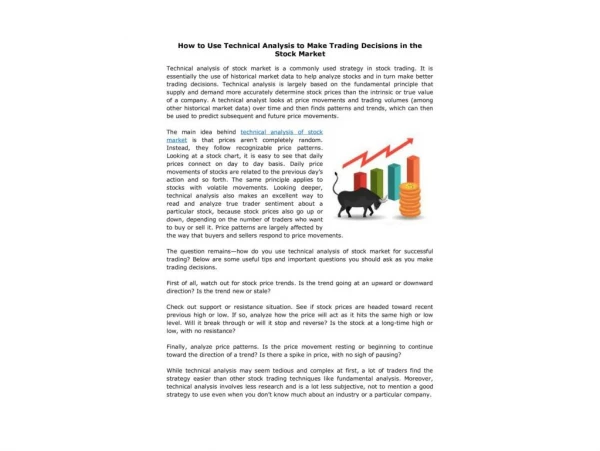
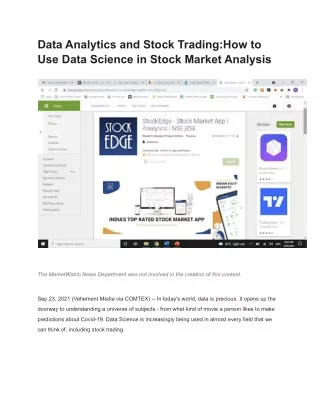
Data Analytics and Stock Trading:How to Use Data Science in Stock Market Analysis The MarketWatch News Department was not involved in the creation of this content. Sep 23, 2021 (Vehement Media via COMTEX) -- In today's world, data is precious. It opens up the doorway to understanding a universe of subjects - from what kind of movie a person likes to make predictions about Covid-19. Data Science is increasingly being used in almost every field that we can think of, including stock trading.
Using Data Science for Stock Market Analysis We all know thatstock market analysis is integral to stock trading, irrespective of whether one is a novice or an expert. While at its simplest form, stock trading involves buying and selling of shares and securities, the main challenge lies in understanding what to buy and sell. And this is where Data Science comes in. For decades, stocks of millions of companies are in circulation across the world. All of them have generated zillions of data over the years. Analysing them to understand exactly which company you should include in your portfolio is not only daunting but almost impossible. Data Science combines the knowledge of maths, statistics and computing to process this data and give us simple understandable outcomes. It gives us a range of insights into a variety of subjects such as understanding the stock market, knowing about a particular stock index, analyzing a company or stock, stock market chart analysis to finally come to the conclusion where to invest and where not to. Now, the obvious question is how can a layman use Data Science for stock market analysis. Don't worry. You don't have to use complicated algorithms yourself. These days, various stock analysis apps are available which can help you with this. Not just stock analysis, these apps provide a range of benefits to users and can be your friend in your stock trading journey.
Here are 5 stock market analysis apps that can make researching easier for you! Best Apps for Stock Analysis 1. Stock Edge StockEdge provides a range of materials to traders and investors, thus helping them in their decision making. It includes more than 200 technical and fundamental end-of-day scans such as price scans, volume and delivery scans, technical scans, fundamental scans, futures scans, options scans, candlestick scans and many more. During stock trading, while it is okay to depend on analysts' recommendations, it is always better to do be able to research on your own. This app empowers you to do just that. Key Features: ● ● ● Has both free and premium versions. Can be used both for stock trading and mutual fund investment. Offers premium features for stock trading with 300+ technical and fundamental analyses, portfolios for big investors, thematic stock lists, readymade strategies, advanced charting tools, case studies, IPO notes and much more. Also has premium features for mutual funds where you can get filtered mutual funds based on themes. ●
2. Money Control Coming from the famous brand Money Control, this app combines a wide range of stock market news and updates to remain up to date about what's happening in the economy. Not only the stock market (NSE and BSE exchanges) but you can get news updates about mutual funds, commodities (MCX and NCDEX exchanges), currencies, futures and options as well. Apart from news, Money Control App also includes interactive and historic charts for stock market chart analysis. Key Features: ● ● Stay tuned to the latest news from the market. Since Money Control is a part of CNBC, you can get all-day market news from CNBC through the app. Provides a range of data such as in-depth market data from BSE, NSE, MCX and NCDEX. Offers interactive and historical charts. ● ● 3. Market Mojo Although this stock analysis app includes both fundamental and technical analysis options, we find it specifically useful for fundamental analysis. You can research any stock, monitor the markets, download reports, follow company results and financial trends, set your own screening parameters and more!
It also offers 10-12 model portfolios where you can invest. This may be particularly useful for novice traders who are not sure where to start. It also offers an option to upload your portfolio and seek expert advice on what to keep and what not. Key Features: ● ● ● It covers a wide range of fundamental and technical analysis indicators. The app offers model portfolios which can be very useful for novice traders. You can seek advice on your existing portfolio. 4. Trendlyne Another good stock market analysis app, Trendlyne provides you with a range of options to stay tuned to the market. It has separate sections for new investors and expert investors. The app covers stocks, futures and options, as well as mutual funds. It ranks stocks based on Durability, Value and Momentum (DVM) as well as based on SWOT. You can upload your portfolio on this app and seek expert advice on it. It also provides several tried and tested trading strategies to follow. Expert investors also have the option of creating their own strategy and backtest it on the app. Apart from technical and fundamental analysis, the app also provides market and corporate news updates. Key Features: ● ● ● It has separate sections for new and expert investors. Ranks stocks based on DVM and SWOT. Offers existing portfolio health checks.
● Has proven strategies that you can follow. Experts can create their own strategy and backtest it. 5. Yahoo Finance Yahoo Finance is a globally popular app that offers a wide range of financial coverage. Yahoo Finance offers insights into global markets and covers a broad range of indices. While downloading, it will ask you about the region/country. Choose India to get updates about the Indian market. However, if you are interested in the global market, this app can help you track that too. This app covers a wide range of subjects including daily market news, stock tickers, real-time market data, after-hours data etc. You can create a profile in the app and view the profile from Yahoo Finance on your PC too. Key Features: ● ● ● ● ● ● Simple and easy to use interface. For stocks, commodities, currencies, derivatives, bonds, global indices, etc. You can track daily market summaries and news. Has an interactive full-screen chart for tracking stocks. You can create your own watchlist. It has a web version, hence can be used from PC. We hope you find the above list useful and find an app that suits your trading needs. Happy Trading!!!