Download
1 / 22
0 likes | 25 Views
Running quantile regression in EViews is a high-level skill. To have better understanding on EViews, students need to rely on EViews assignment help by Economics Help Desk experts.

E N D
Quantile regression is a strong statistical technique, particularly for modeling interactions between variables when the assumptions of ordinary least squares (OLS) regression are inadequate. Unlike OLS, which only estimates the dependent variable's conditional mean, quantile regression may estimate conditional quantiles as well. This implies you may look at how predictor factors impact various points on the result distribution (for example, the median, upper quartile, and lower quartile). Quantile regression is especially useful when the relationship between variables varies across the distribution or when heteroscedasticity exists. For example, if you're researching the link between income and education, the impact of education may differ for people at the bottom of the socioeconomic hierarchy vs those at the top. Economicshelpdesk.com
• Flexibility: Unlike the OLS method, it does not assume a constant variance of errors. • Insight across the distribution: Quantile regression enables to estimate the effect of predictors at different point of distribution (median, lower/upper quantile) and so obtain more detailed information about the relationship between variables. • Robustness to outliers: It is less influenced by outliers due to the focus on conditional quantiles whereas OLS regression might be affected by extreme value. The presentation covers 7 essential steps for conducting quantile regression in EViews, a widely-used software for econometrics. It also addresses common errors that students encounter and suggests seeking professional EViews assignment help to mitigate these issues effectively.
An important precondition to the quantile regression analysis is to get the best understanding of the data set to be used. For the purposes of this example, we’ll use a well-known dataset: the ‘autosales’ dataset, which contains information about car prices, engine size, horsepower, and other variables. Dataset Details: Dependent Variable: Car price Independent Variables: Engine size, horsepower, and other specifications such as brand, year, and mileage. This dataset works well for applying the quantile regression since the influential factors such as the size of the engine and horsepower of the car might have its impact differently at the different price levels or the quantiles. Tip: It is a good practice to look at your data carefully prior to engaging in regression analysis. Some of the key checks for performing regression analysis are: checking for the presence of missing values, variable distribution, and outliers.
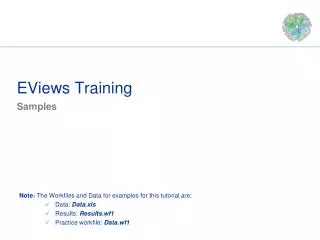
To get started, you’ll first need to import your dataset into EViews. EViews supports multiple file formats, including Excel (.xls, .xlsx), CSV, and text files. Follow these steps to import your data: 1.Open EViews and go to File → Import → Read Text-Lotus-Excel... 2.Select your file (e.g., auto_sales.xlsx) and choose the appropriate settings to import the dataset. 3.Once imported, the data should appear in the Workfile window, showing a table with all the variables. Tip: It should be ensured that the names of the variables are right. For example, if one of your independent variables is “EngineSize” ensure it is entered as a continuous variable and not as text. Economicshelpdesk.com
Once your dataset is ready, the next step is to specify the quantile regression model in EViews. Let’s say you want to explore the 25th, 50th (median), and 75th quantiles of car prices based on the independent variables such as engine size and horsepower. To do this in EViews: 1.Click on Quick → Estimate Equation. 2.In the dialog box that opens, select Quantile Regression from the method dropdown. 3.Here, car_price is the dependent variable, and engine_size and horsepower are independent variables. 4.In the Quantiles section, specify the quantiles of interest. For example, for the 25th, 50th, and 75th quantiles, you would enter 0.25 0.50 0.75. Once you have done this, EViews will run the regression and display the results. Economicshelpdesk.com
Quantile regression results in EViews can look a bit confusing at first, but the key is to focus on the following: Quantile Estimates: EViews will show you separate estimates for each quantile. For example, if engine size has a significant positive effect on car prices at the 75th quantile but not at the 25th, this means larger engines increase the price more for higher-priced cars. Standard Errors and Significance Levels: As with OLS, pay attention to the standard errors and significance levels (p-values). This will help you determine whether the relationships you’ve uncovered are statistically significant. Tip: Do not forget the interpretation of the results at different quantiles. One important thing for quantile regression which is not present on OLS is its insightful information across the whole distribution. Economicshelpdesk.com
It is necessary to plot your results so as to see your independent variables’ impact across various quantiles. In the case of EViews, there are several options to plot results of the quantile regression analysis. To create a graph in EViews: 1.Go to the View menu in the results window. 2.Select Graph → Quantile Coefficient Plot. 3.This will generate a graph showing how the coefficients for your independent variables change across quantiles. This kind of visualization is helpful since it enables the researcher to graphically analyse variations in relationships throughout the outcome distribution. It is used in the identification of patterns and trends which are not easily recognizable when tabulated. Economicshelpdesk.com
Quantile regression in EViews is generally straightforward, but there are a few common mistakes students often make: Ignoring Heteroscedasticity: The first and major strength of the quantile regression is that it is resistant to heteroscedasticity. Nevertheless, a large number of students apply OLS method in cases when variance of the errors is not constant leading to inefficient estimates. Misinterpreting Results: Students may commit mistake in depicting the coefficients from various quantiles as similar to OLS. As it is mentioned earlier, quantile regression aims to find how the independent variables influence various points of the outcome distribution. Choosing Inappropriate Quantiles: Some students choose too many quantiles or focus only on extreme quantiles (like 5% or 95%) without assessing their relevance to the research question. Solution: Such problems can be solved with EViews assignment help. Researchers can help you in appropriate modelling, correct analysis of the results, and selection of most suitable quantiles for your investigation.
The last part of the process is to export the output and the results for your assignment report. When it comes to outputs EViews makes it easy to export the tables and the graphs as well. To export: 1.Go to File → Export and choose the format (e.g., Excel or Word) to save your output. 2.For graphs, right-click the graph window and select Save As to export the visualizations in PNG or JPG format. When writing your report, ensure you include: • A brief description of your dataset. • A clear explanation of your model. • Interpretation of your results at different quantiles. • Visualizations to support your conclusions. Economicshelpdesk.com
Running quantile regression in EViews is a high-level skill which is very useful for statistics students, as it helps to gain better understanding of the relationships of the data as a whole distribution. By following the 7 essential steps outlined in this guide- understanding the dataset, specifying the model, interpreting results, visualizing outcomes, and avoiding common mistakes- you can confidently perform quantile regression for your assignments. For those who need assistance, EViews assignment help can provide useful tips, ensuring accurate and efficient analysis. Economicshelpdesk.com
Here are some textbooks and resources that can help you deepen your understanding of quantile regression and econometrics: 1."Econometric Analysis" by William H. Greene - A comprehensive guide for econometrics students. 2."Quantile Regression" by Roger Koenker - The go-to text for understanding the theory and application of quantile regression. 3.EViews User’s Guide - Available directly in the software or online, this guide provides detailed instructions and examples. Economicshelpdesk.com
Economicshelpdesk.com Whatsapp or Call: +44-1666260813 Email: info@economicshelpdesk.com