Download
1 / 3
30 likes | 60 Views
Telecommunications service 100 marks<br><br>A consulting firm is investigating the level of service provided by a telecommunication company in resolving customer issues. Data was obtained from a sample of 999 customer reviews which included variables such as age, income, number of enquiries made to resolve issue, etc. This information is available in the file A1_Data.xlsx,which has columns containing the following variables.<br><br>Customer_ID: customer’s ID<br>Age: age = 1<br>Gender: 1 = female, 0 =male<br>Married: marital status, Y = married, N = otherwise<br>Postcode: postcode<br>Employment: 1 = Employed, 0 = Unemployed<br>Time Spent: time spent to resolve the issue (minutes)<br>Rating: rating for the service from 1 to 5 (1=the lowest, 5=the highest)<br>Enquiries: number of enquiries made to resolve the issue<br>Based on the data provided, answer the following questions:<br><br> Select two different kinds of qualitative variables and two different kinds of quantitative variables. State whether the variable is nominal, ordinal, discrete or continuous. Explain your reasoning in each case. 5 marks<br> Is the data “cross-sectional†or “time-series†data? Explain your answer.<br>2 marks<br><br> A recent report states the following: i. there is an even spread of the number of enquiries made to resolve the issue. ii. ratings are quite evenly distributed. Do you agree with these two statements? Justify your answers for both statements by providing relevant tables for each statement. 8 marks<br>Construct two Pivot Tables using the number of enquiries and age groups, one using percentage column total and the other row total. (Hint: Group age using interval widths of 15 years, beginning with 16 years of age). 6 marks<br>For each level of enquiry,<br>which is the dominant age group? Are they younger or older customers?<br>why is this the case?<br>Support your discussion with the aid of a table. 5 marks<br><br> Are male customers making more enquiries than female customers? Provide a brief explanation. Support your answer with the aid of a table. 6 marks<br> Complete the following tables of summary statistics of time spent for each of the following two variables:<br>Gender<br>Hint: sort the data by Gender, then calculate the summary statistics of time spent for the two genders separately.<br><br>Rating (in two groups 1-3 and 4-5)<br>Hint: sort the data by Rating, then calculate the summary statistics of time spent for the rating from 1 to 3 group and rating from 4 to 5 group separately.<br><br>Give your answers in the following tables to two decimal places and make sure you indicate units. 10 marks<br><br> Time Spent<br> Male Female<br>Mean <br>Median <br>Standard Deviation <br>First Quartile <br>Third Quartile <br>Interquartile Range <br>Range <br>Minimum <br>Maximum <br>Coefficient of Variation <br> Time Spent<br> Rating 1-3 Rating 4-5<br>Mean <br>Median <br>Standard Deviation <br>First Quartile <br>Third Quartile <br>Interquartile Range <br>Range <br>Minimum <br>Maximum <br>Coefficient of Variation <br> Construct percentage frequency histograms of the Time Spent for the two rating groups:<br>1) Rating 1-3<br><br>2) Rating 4-5<br><br>Hint: You may need to sort the data by Rating, then copy the Time Spent data with rating 1-3 to the column K (under the variable name “Time (Rating 1-3)â€) and that with rating 45 to the column M (under the variable name “Time (Rating 4-5)â€) separately. In the histogram, group Time Spent using interval widths of 8 minutes, beginning with 0 minutes. 8 marks<br><br>Based on your answers obtained in parts g and h, compare the distribution of the variable Time Spent for the two rating groups (Low: rating 1-3 and High: rating 4-5), discussing typical values (i.e. “central tendencyâ€), how spread out the values are (“variabilityâ€), and the shape of the distributions. Which of the genders shows more variability in Time Spent? Explain using appropriate evidence. Quote the values to two decimal places and make sure you indicate units. 15 marks

E N D
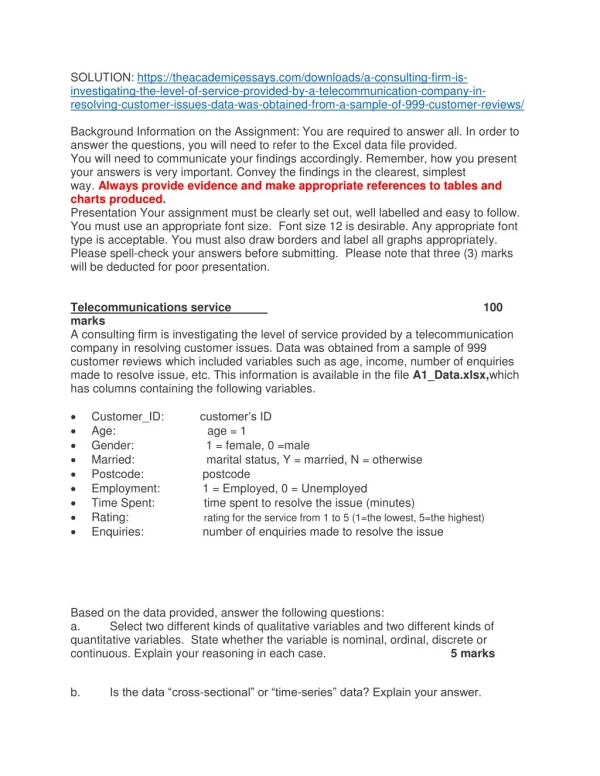
SOLUTION: https://theacademicessays.com/downloads/a-consulting-firm-is- investigating-the-level-of-service-provided-by-a-telecommunication-company-in- resolving-customer-issues-data-was-obtained-from-a-sample-of-999-customer-reviews/ Background Information on the Assignment: You are required to answer all. In order to answer the questions, you will need to refer to the Excel data file provided. You will need to communicate your findings accordingly. Remember, how you present your answers is very important. Convey the findings in the clearest, simplest way. Always provide evidence and make appropriate references to tables and charts produced. Presentation Your assignment must be clearly set out, well labelled and easy to follow. You must use an appropriate font size. Font size 12 is desirable. Any appropriate font type is acceptable. You must also draw borders and label all graphs appropriately. Please spell-check your answers before submitting. Please note that three (3) marks will be deducted for poor presentation. Telecommunications service 100 marks A consulting firm is investigating the level of service provided by a telecommunication company in resolving customer issues. Data was obtained from a sample of 999 customer reviews which included variables such as age, income, number of enquiries made to resolve issue, etc. This information is available in the file A1_Data.xlsx,which has columns containing the following variables. Customer_ID: customer’s ID Age: age = 1 Gender: 1 = female, 0 =male Married: marital status, Y = married, N = otherwise Postcode: postcode Employment: 1 = Employed, 0 = Unemployed Time Spent: time spent to resolve the issue (minutes) Rating: rating for the service from 1 to 5 (1=the lowest, 5=the highest) Enquiries: number of enquiries made to resolve the issue Based on the data provided, answer the following questions: a. Select two different kinds of qualitative variables and two different kinds of quantitative variables. State whether the variable is nominal, ordinal, discrete or continuous. Explain your reasoning in each case. 5 marks b. Is the data “cross-sectional” or “time-series” data? Explain your answer.
2 marks c. A recent report states the following: i. there is an even spread of the number of enquiries made to resolve the issue. ii. ratings are quite evenly distributed. Do you agree with these two statements? Justify your answers for both statements by providing relevant tables for each statement. 8 marks d. Construct two Pivot Tables using the number of enquiries and age groups, one using percentage column total and the other row total. (Hint: Group age using interval widths of 15 years, beginning with 16 years of age). 6 marks e. For each level of enquiry, i. which is the dominant age group? Are they younger or older customers? ii. why is this the case? Support your discussion with the aid of a table. 5 marks f. Are male customers making more enquiries than female customers? Provide a brief explanation. Support your answer with the aid of a table. 6 mark g. Complete the following tables of summary statistics of time spent for each of the following two variables: i. Gender Hint: sort the data by Gender, then calculate the summary statistics of time spent for the two genders separately. ii. Rating (in two groups 1-3 and 4-5) Hint: sort the data by Rating, then calculate the summary statistics of time spent for the rating from 1 to 3 group and rating from 4 to 5 group separately. Give your answers in the following tables to two decimal places and make sure you indicate units. 10 marks Male Mean Median Standard Deviation First Quartile Third Quartile Interquartile Range Range Minimum Maximum Coefficient of Variation Rating 1-3 Mean Time Spent Female Time Spent Rating 4-5
Median Standard Deviation First Quartile Third Quartile Interquartile Range Range Minimum Maximum Coefficient of Variation h. Construct percentage frequency histograms of the Time Spent for the two rating groups: 1) Rating 1-3 2) Rating 4-5 Hint: You may need to sort the data by Rating, then copy the Time Spent data with rating 1-3 to the column K (under the variable name “Time (Rating 1-3)”) and that with rating 45 to the column M (under the variable name “Time (Rating 4-5)”) separately. In the histogram, group Time Spent using interval widths of 8 minutes, beginning with 0 minutes. 8 mark i. Based on your answers obtained in parts g and h, compare the distribution of the variable Time Spent for the two rating groups (Low: rating 1-3 and High: rating 4-5), discussing typical values (i.e. “central tendency”), how spread out the values are (“variability”), and the shape of the distributions. Which of the genders shows more variability in Time Spent? Explain using appropriate evidence. Quote the values to two decimal places and make sure you indicate units. 15 marks