Download
1 / 44
470 likes | 1.26k Views
1. 2. 3. The Federal Water Pollution Control Act of 1948. Provided state and local governments with technical assistance funds to address water pollution problems, including research Water pollution was viewed as primarily a state and local problem

E N D
The Federal Water Pollution Control Act of 1948 • Provided state and local governments with technical assistance funds to address water pollution problems, including research • Water pollution was viewed as primarily a state and local problem • When it came to enforcement, federal involvement was strictly limited to matters involving interstate waters and only with the consent of the state in which the pollution originated.
Water Quality Act of 1965 • Required states to set standards for interstate waters that would be used to determine actual pollution levels and control requirements • By the late 1960s, there was a widespread perception that existing enforcement procedures were too time consuming and that the water quality standards approach was flawed because of difficulties in linking a particular discharger to violations of stream quality standards • Mounting frustration over the slow pace of pollution cleanup efforts and a suspicion that control technologies were being developed but not applied to the problems.
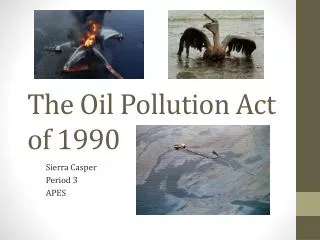
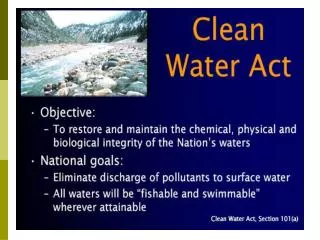
The Clean Water Act of 1972 • The cornerstone of surface water quality protection in the United States • The Act does not deal directly with ground water • Employs a variety of regulatory and non-regulatory tools to sharply reduce direct pollutant discharges into waterways, finance municipal wastewater treatment facilities, and manage polluted runoff 7
Changes Brought by the 1972 Act • Brought about the most significant change in the law • Instituted a shift: • From reliance on violations of water and quality standards as the primary enforcement tool, … • To establishment of specific technology-based effluent limitations that are enforceable as permit conditions CWA 8
Under the ’72 Clean Water Act, … • All discharges into the nation’s waters are unlawful, unless specifically authorized by a permit. • More than 65,000 industrial and municipal dischargers must obtain permits from EPA or qualified states • Industries were given until July 1, 1977 to install “best practicable control technology” (BPT) to clean up waste discharges. • Municipal wastewater treatment plants were required to meet an equivalent goal, termed “secondary treatment,” by July 1, 1977 • According to EPA, 86% of all cities met the 1988 extended deadline • The remainder were put under administrative or court-ordered schedules requiring compliance as soon as possible.
Permits • Permits specify the control technology applicable to each pollutant, the effluent limitations a discharger must meet, and the deadline for compliance. • Sources are required to maintain records and to carry out effluent monitoring activities. • Permits are issued for five-year periods and must be renewed to allow continued discharge
Best Practicable Technology (BPT) • The primary focus of BPT was on controlling discharges of conventional pollutants, such as suspended solids, biochemical oxygen demanding materials, fecal coliform and bacteria, and pH • These pollutants are substances which are biodegradable (i.e., bacteria can break them down), occur naturally in the aquatic environment, and deplete the dissolved oxygen concentration in water which is necessary for fish and other aquatic life
From BPT to “Best Available Technology” (BAT) by March 31, 1989 • Industry use the “best available technology” (BAT) that is economically achievable • BAT level controls generally focus on toxic substances
1972 Clean Water Act • Its objective was the restoration and maintenance of the chemical, physical, and biological integrity of the nation’s waters • Two goals were established: • Zero discharge of pollutants by 1985 • Water quality that is both “fishable” and “swimmable” by mid-1983 • Goals not yet reached…
Total Maximum Daily Load (TMDL) • Defined: Amount of a specific pollutant that a water body can receive and still meet water quality standards • States are required to develop TMDLs for waters on their 303(d) lists • EPA approves or disapproves state TMDLs • If disapproved, EPA sets the TMDL • EPA estimates that nearly 34,000 U.S. waters are impaired and require preparations of TMDLs.
Control of Toxic Pollutant Discharges • A key focus of water quality programs • Environmental Protection Agency (EPA) issues regulations containing the BPT and BAT effluent standards applicable to categories of industrial sources • In addition to the BPT and BAT national standards • States are required to implement control strategies for waters expected to remain polluted by toxic chemicals even after industrial dischargers have installed the best available cleanup technologies required under the law
In Addition to BPT and BAT, … • EPA has issued water quality criteria for more than 115 pollutants, including 65 named classes or categories of toxic chemicals, or “priority pollutants” • These criteria recommend ambient, or overall, concentration levels for the pollutants and provide guidance to states for establishing water quality standards that will achieve the goals of the act
Before 1987….and After 1987 • Before 1987: Programs aimed at “point sources” of water pollution • After the 1987 Amendments to the CWA: New focus of programs was “non-point source” water pollution • Storm water runoff from farm lands, forests, construction sites, and urban areas
NPDES Permits for Point Sources • National Pollutant Discharge Elimination System (NPDES) Permits: • Must be applied for and obtained by anyone discharging pollutants into U.S. waters (from any point source) • Specify the discharge standards and monitoring and reporting requirements that a facility must achieve for each point source or outfall CWA 18
NPDES Permits for Point Sources • Require more stringent controls when toxic pollutants are discharged • Regulations for toxics are based on best available and economically achievable technology (Section 307) CWA 19
NPDES Permits for Point Sources • Can be made more stringent if the specific water body requires lower discharges to meet water quality standards under Total Maximum Daily Load (TMDL) regulations CWA 20
NPDES Permits for Non-Point Sources: Section 319 • NPDES permit program expanded in 1992 to include storm water and other non-point source discharges, including: • parking and storage lots • agricultural storm water discharges • As much as 50% of U.S. water pollution comes from non-point sources (l987 estimate) CWA 21
Are Permits Required for Nonpoint Sources of Pollution? • Nonpoint sources of pollution are not subject to CWA permits or other regulatory requirements under federal law • They are covered by state programs for the management of runoff, under Section 319
Non-Point Sources • Section 303(d) requires states to list waterways that do not meet federal or state water quality standards • These listed waterways are subject to TMDL standards • Federal grants cover up to 60% of program implementation costs CWA 23
Sanctions (Enforcement Options) • EPA may issue a compliance order or bring a civil suit in U.S. district court against persons who violate the terms of a permit. • The penalty for such a violation can be as much as $25,000 per day • Stiffer penalties are authorized for criminal violations of the act — for negligent or knowing violations — of as much as $50,000 per day, three years’ imprisonment, or both. • A fine of as much as $250,000, 15 years in prison, or both, is authorized for ‘knowing endangerment’ — violations that knowingly place another person in imminent danger of death or serious bodily injury • In addition, EPA is authorized to assess civil penalties administratively for certain well-documented violations of the law
States Do Most of the Enforcing • The majority of actions taken to enforce the law are undertaken by states • States issue the majority of permits to dischargers • The federal government lacks the resources for day-to-day monitoring and enforcement • EPA has oversight of state enforcement and retains the right to bring a direct action where it believes that a state has failed to take timely and appropriate action or where a state or local agency requests EPA involvement • The federal government acts to enforce against criminal violations
Controversies with the CWA • EPA's approach: Focuses on point-source pollution, almost ignoring non-point source pollution • Little state-level incentives to look at non-point source pollution such as agricultural pesticides • TMDLs: States are required to set the maximum amount of pollution that a water body can receive without violating water quality standards. 26
Controversies with the CWA • Sewage Sludge: EPA was slow to issue regs for disposal of municipal sewage sludge (finally proposed in l989, with final regs issued in late l992). • Industrial Pretreatment: Industries that discharge wastes into city sewers must first remove toxics that would interfere with operation of the city's wastewater treatment plant. • Many cities fail to bring strong enforcement actions against industries that violate pretreatment standards. 27
What Do We Know? • How many NPDES permits have been issued? (Slide #9) • What percent of the nation’s waters are “swimmable” and “fishable” now? In 1972? (Slide #2) • Which of the nation’s waters was covered by the 1948 Water Pollution Control Act? (Slide #4) • First comprehensive statement of federal interest in clean water programs
What Do We Know? • What was the “paradigm” shift in the 1972 Clean Water Act (Amendments)? (Slide #8) • What point-source water pollutants are controlled by NPDES permits? (Slides # 11, 15-16) • Which government agency in Missouri issues NPDES permits? (Slide #25)
What Do We Know? • Which water pollutants are the focus of BAT standards? Of BPT standards? (Slides #11-12, 16) • How did the focus of the CWA change with the 1987 Amendments? (Slide #17) • What is a “TMDL?” Who sets it? How is it enforced? (Slides #14, 20, 23)
Assessing the CWA Act • In the 1972 Clean Water Act [CWA], Congress established a goal of zero discharge by 1985. • The discharge permitting program was meant as an interim program for most sources. • Congress also aimed for our waters to be fishable and swimmable by 1983. • Yet today, the zero discharge goal has long been forgotten. • Fewer than one-half of our waters have even been assessed. • Of those, only about half meet their designated uses. • And for most of those the designated use is something less than fishable and swimmable. • Most sewage is treated
Missouri: CWA Enforcement • Source: New York Times (2009), http://www.nytimes.com/interactive/2009/09/13/us/0913-water.html • Missouri • 3,059 regulated facilities • 779 violating facilities • 25.5 violations per 100 facilities • 6.3 enforcements • 0.8 enforcements per 100 violations
Iowa: CWA Enforcement • 1,567 registered facilities • 591 violating facilities • 37.7 violations per 100 facilities • 15.1 enforcements • 2.6 enforcements per 100 violations
Illinois & CWA Enforcement • 1,815 registered facilities • 1,140.5 violating facilities • 62.9 violations per 100 facilities • 83 enforcements • 7.3 enforcements per 100 violations
Texas & CWA Enforcement • 2,839 registered facilities • 1,982.6 violating facilities • 69.8 violations per 100 facilities • 151.6 enforcements • 7.6 enforcements per 100 violations
North Carolina • 1,330 registered facilities • 667.6 violating facilities • 50.2 violations per 100 facilities • 573 enforcements • 85.8 enforcements per 100 violations • North Carolina had the highest number of enforcement actions (of any state), punishing 85 of every 100 facilities that were out of compliance • But sanctions mostly consisted of small fines, averaging $1,387 per violation
Kansas • 1,111 registered facilities • 118.2 violating facilities • 10.6 violations per 100 facilities • 13.8 enforcements • 11.7 enforcements per 100 violations • Kansas cites a workload that has grown faster than their resources. Officials there said clearly there is a shortfall in meeting the resource needs of the nation’s water quality program.
Nebraska • 674 registered facilities • 264.4 violating facilities • 39.2 violations per 100 facilities • 63.2 enforcements • 23.9 enforcements per 100 violations
Ohio • 3,115 registered facilities • 1,939.7 violating facilities • 62.3 violations per 100 facilities • 19.2 enforcements • 1 enforcement per 100 violations • Violation rates are high, according to Ohio officials, because they test so frequently and for so many parameters
California • 2,161 registered facilities • 579.5 violating facilities • 26.8 violations per 100 facilities • 142.5 enforcements • 24.6 enforcements per 100 violations • California officials said their violation rates were so high because they test so frequently and for so many parameters
Arkansas • 795 registered facilities • 518.4 violating facilities • 65.2 violations per 100 facilities • 13.8 enforcements • 2.7 enforcements per 100 violations • Arkansas officials said many violations are because of overdue reports or incomplete paperwork, rather than toxic emissions
Florida • 477.5 registered facilities • 133.8 violating facilities • 28 violations per 100 facilities • 57.1 enforcements • 42.7 enforcements per 100 violations • Florida officials said their violation rates were so high because they test so frequently and for so many parameters http://www.nytimes.com/interactive/2009/09/13/us/0913-water.html
Oklahoma • 483.3 registered facilities • 346.3 violating facilities • 71.7 violations per 100 facilities • 160.7 enforcements • 46.4 enforcements per 100 violations • http://www.nytimes.com/interactive/2009/09/13/us/0913-water.html
Pennsylvania • 4,355 registered facilities • 392.2 violating facilities • 9 violations per 100 facilities • 20.3 enforcements • 5.2 enforcements per 100 violations