Download
1 / 32
340 likes | 889 Views
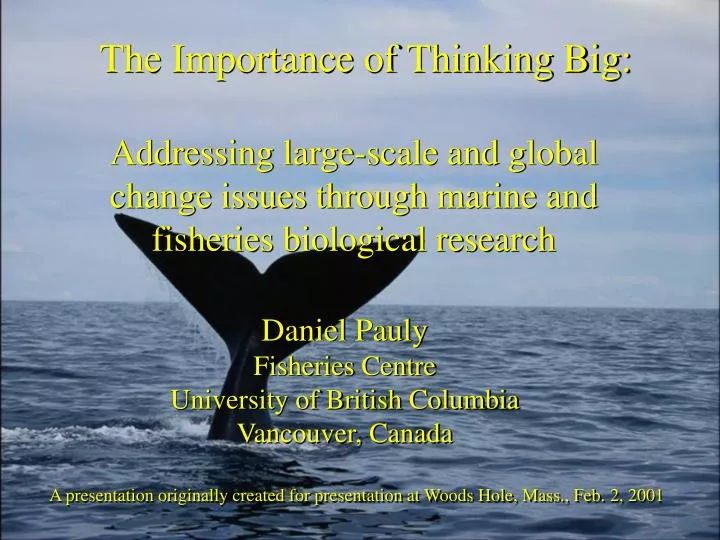
The Importance of Thinking Big:. Addressing large-scale and global change issues through marine and fisheries biological research. Daniel Pauly Fisheries Centre University of British Columbia Vancouver, Canada.

E N D
The Importance of Thinking Big: Addressing large-scale and global change issues through marine and fisheries biological research Daniel Pauly Fisheries Centre University of British Columbia Vancouver, Canada A presentation originally created for presentation at Woods Hole, Mass., Feb. 2, 2001
This contribution… • Was originally created for an event connected with Black History Month (February), over a year ago; • Thus, it is both dated, and has a very personal ‘feel;’ • Nevertheless, it may appeal to Aqualink members in that it describes how a young scientist (yes, I was once young!) broadened his vision, and ended up leading a project (see www.fisheries.ubc.ca/project/saup) with a global scope; • The slides have not been updated; visit our web site for the follow up to this presentation. • So here we go…
… This also being a report of how one scientist grew with age: • The object of my first paper (1973) had a length of 30 cm;
… This also being a report of how one scientist grew with age: • The object of my first paper (1973) had a length of 30 cm; • The study area of my Ms thesis (1974) was a one km2 lagoon in Ghana, West Africa;
… This also being a report of how one scientist grew with age: • The object of my first paper (1973) had a length of 30 cm; • The study area of my Ms thesis (1974) was a one km2 lagoon in Ghana, West Africa; • The survey area during my first job, in Indonesia, (1975-1976) was 106 km2;
… This also being a report of how one scientist grew with age: • The object of my first paper (1973) had a length of 30 cm; • The study area of my Ms thesis (1974) was a one km2 lagoon in Ghana, West Africa; • The survey area during my first job, in Indonesia, (1975-1976) was 106 km2; • And I now work on the global ocean (3.6*108 km2). Definitely a change of scale….
But why such broadening of scale? • In the 1970s, the idea was that the fisheries of developing countries should … well develop, and then be managed using analytic models such as were then applied to the management of North Atlantic fisheries;
But why such broadening of scale? • In the 1970s, the idea was that the fisheries of developing countries should … well develop, and then be managed using analytic models such as were then applied to the management of North Atlantic fisheries; • Hence, one needed to know the growth and natural mortality of key species…
Moreover, hundreds of species were showing up in catches, and they could not be aged and sampled as can be done, e.g. in New England • Hence the need to develop length-based method for the estimation of growth; • And the need to develop a predictive model for estimating natural mortality from easy-to estimate parameters; • And, as well, the need to ensure that available estimates of these parameters did not disappear in the gray literature. These then led to the development of….
Electronic Length-Frequency Analysis (ELEFAN), widely used in developing countries… (see www.fisat2000.org for updates)…
A widely-used empirical model for estimating M (natural mortality) from growth parameters and mean environmental temperature
See www.fishbase.org to learn why We get over 750,000 ‘hits’ permonth.
One neat aspect of FishBase, incidentally, is that its high quality standards generate equality among its contributors, wherever they are from….
But then, all of this assumes single-species management works…. • Yet every species the fisheries exploit is embedded in an ecosystem, both as predator and prey, • and thus the mutual impacts of fisheries exploiting different species must be considered. • Hence the need for ecosystem-based management. No fish is an island
Fortunately, the ‘franchise’ for a neat ecosystem modeling approach (Ecopath) was available…. • And so Ecopath was made accessible (& taught) to a vast number of colleagues (2300 registered users in 120 countries, see www.ecopath.org); • Which resulted not only in a better understanding of the concept of ‘trophic levels’ (TL), but also in many estimates of TL …
Trophic level: the concept 4 Top predators 10% 3 Prey fish Trophic level 10% 2 Zooplankton 10% . . . . . . . . . . . . . . *. . . . . . . . . . *. *. *. *. *. *. 1 Phytoplankton *. *.
The TL for species of species groups in FishBase; And the global FAO database of fisheries catches. The equation used: TLi=1+ DCij TLj for (groups of) species i with prey j; and TLk = Yik TLi / Yi given catches (Y) by year (k) – simple stuff. So it became possible to estimate TLs for the world’s fisheries, using two sources of data:
Primary production required to sustain global fisheries (Pauly and Christensen, Nature, 1995) Fishing down marine food webs (Pauly et al., Science, 1998) This led to two rather visible contributions on:
PPR to Sustain Global Fisheries Non-tropical shelves: 35% Tropical shelves: 35% Rivers/ lakes: 24% Terrestrial average: 35-40% Coastal/reefs: 8% Open ocean: 2% Upwelling: 25% Nature 1995, 374
Global fishing down the food web Marine Freshwater Science March 1998, 279
And, because one shouldn’t quit when on a roll, we are working on: • Harmonizing global ecosystem classifications, to accelerate the transition to ecosystem-based management; • Mapping the world catch, using rule-based approaches (not coloring crayons!); • Comparing the present state of ecosystem on ocean-wide scale with their state 50 years ago.
2 But then, catches by FAO area are not much better..
2 Here are catches by half degree squares. Better.
And this will allow us to start: • Evaluating the cost of rebuilding some or our depleted marine ecosystems, or of not doing so; • Inferring where changing fisheries operations will conflict with conservation of biodiversity; • Interfacing with predicted scenarios from global circulation models, and hence join the community that attempts to deal with the changes that global warming will cause.
I will stop here: any more growth would be too much… • Thanks to Ambrose Jearld, for having me invited to speak here, and to all those who helped me have something to say: Villy Christensen, Reg Watson and my other friends at UBC, Prof. G. Hempel in Germany (for supporting me as an unruly student), Jack Marr for hiring me as an ICLARM postdoc (against sound contrary advice) and all these wonderful colleagues on five continents; • My recent research is supported by the Pew Charitable Trusts, Philadelphia, and National Science and Engineering Council of Canada.